Examining the puzzles and concerns over the latest construction output figures
The Office for National Statistics output figures released on Friday strongly suggest construction is heading for a technical recession. Put another way, recorded output will need major revisions or an exceptional boost in March if we are not to see two successive quarters of decline.
The data suggest output in both January and February, when adjusted for inflation and seasonal factors, was lower than for any month since December 2013. On its current trajectory we are looking at a recorded fall in output of about 3% in the first quarter to add to a 2.2% fall in the final quarter of last year.
Not surprisingly these figures were greeted with surprise. Not least because there is a broadening belief that construction is set for strong growth with concerns turning to skills shortages not lack of work opportunities.
The Daily Telegraph’s initial take, for instance, was placed under the headline: “British construction industry suffers shock pre-election collapse.” (the story attached to the link has been updated)
With the Government partners priding themselves on economic competence ahead of the General Election, the figures have taken on particular significance. That significance was magnified by weak industrial production data, heavily depressed by the troubled oil sector.
Whatever the take on the industrial production figures, there will, however, be eyebrows raised over the construction data.
The officially recorded decline in construction sits uneasily with other construction survey data.
So it’s worth looking at what might be behind the conflicting messages coming from the Office for National Statistics and business surveys, which are increasingly upbeat.
The first point I’d make is that there are problems with the official construction data. The issues around deflators are well recorded. Some of the practical problems were discussed in this earlier blog. This particular problem does make it awkward to interpret mid to longer-term trends, but it isn’t the cause of the recent decline in construction output that seems so in conflict with industry soundings.
While most assessments of construction output use seasonally and price adjusted data, to start unpicking what lies behind the recent fall in recorded activity it’s probably best to start by looking at output in current prices (cash terms). This eliminates the effects of statistical adjustments for seasonal effects and inflation.
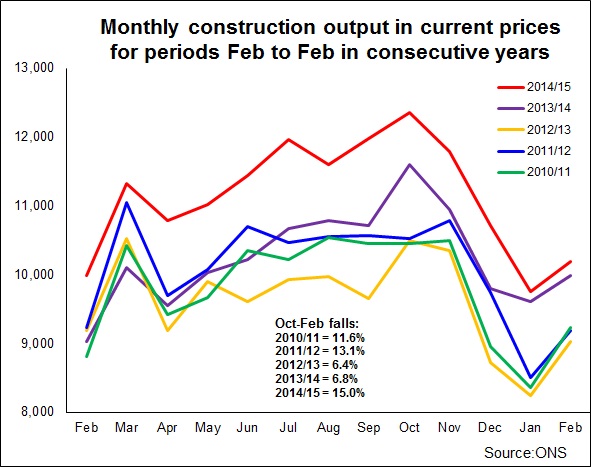 The graph compares monthly output in cash terms for the periods February to February for various years. The first thing you see is the huge seasonal variation, with work steadily picking up through the year and falling pretty rapidly after October.
There are peculiarities in how data can reasonably be collected in construction, this means there is an irritatingly variable and unpredictable lag in how actual activity on the ground feeds through into the numbers recorded each month in the spreadsheets (see blog). So in reality the peak could actually be earlier than this graph suggests. But that isn’t a point worth dwelling on here.
One obvious point of note when comparing the five years is the much sharper drop in output in the months from the October peak to February in the latest data than in the previous two years, when we started to sense a recovery was on its way. Interestingly too, the drop is sharper than in the winter of 2010/11 and 2011/12 when the industry was suffering.
If construction was storming we’d expect the seasonal fall in current price output to be reduced for two reasons. Firstly there would be more work about increasingly lifting successive monthly figures. Secondly, because this is a cash measure, you might expect stronger inflation in wages and materials pushing up the cash price paid for a given amount of construction work. Conversely, if the growth rate slowed or there was a decline in activity we’d expect the fall to be sharper.
This by no means is guaranteed, as firms are tied into contract prices set a while ago. There will be long lag effects. Contracts won a few years ago at silly prices will be passing through the system. This might delay or depress inflation, but it seems very unlikely that it would cause a decline in the price of construction across the board. Certainly the deflators being used by the ONS don’t suggest falling prices, quite the reverse.
So whichever way we read it, the scale of the recent fall in activity at current prices is puzzling. It also raises nagging questions over what might be amiss. Is the data out of line with what’s happening in the real world? Is there a problem with the surveying or with how the survey data is scaling up from the sample?
To get a better feel we might compare the output statistics more closely with trade surveys. Were we to we’d almost certainly see a strong conflict with almost all trade surveys from those produced by the professionals, to those produced by the small builders.
This may provide a reason for concern, but the comparison is problematic for all kinds of reasons. Trade surveys tend not to measure the level of activity but what change firms are seeing in activity. They tend to cover bits of the industry and not the whole and there are inevitable problems with both the sampling and with issues such as cognitive bias, as sentiment plays such a large part in most trade surveys.
But there is an alternative. We could compare construction output with, say, the official employment data. Both surveys seek to track actual levels.
Here we find an immediate conflict. The jobs data, admittedly only up to December, all points to a rising number of workers in construction. All other things equal, this would suggest that workloads had been holding up.
That said while direct employment rose – which might be read as a sign of confidence in the future – there was a hint of a decline in self-employment, which may be an indicator of a short-term drop or slowdown in work. Although it’s probably the effect of firms taking on people directly.
But labour intensity is not even across construction so we need to look at which sectors are growing and which are falling.
The ONS data suggests growth is now driven by new work, while repair and maintenance work is flagging, even in cash terms. This shift in the workload mix should be associated with a reduction in the level of employment for any given volume of work. New work is far less labour intensive.
So rising employment combined with a shift to less labour intensive work points to growth in activity. So the construction output data again seem to be at odds with other data.
However, in an industry as muddled as construction there are plenty of ways you might square this apparent contradiction. One immediate point to make is that changes in employment tend to lag changes in workload. But, for me at least, the comparison of the employment and activity data does provide a bit of concern over whether there has been an under measurement of late in the work undertaken by contractors.
Despite these concerns, I’d be cautious of reading too much into this. The construction data are volatile and need to be considered over a reasonable time period. There are peculiarities in the data, such as an irritating variable and unpredictable lag mentioned early.
There are awkward issues around definitions of what is and isn’t construction and indeed tracking what gets included and what doesn’t. Furthermore construction work is undertaken directly by organisations not classified as construction. This will not be counted. So if organisations, such as housing associations, or businesses, such as supermarkets, start taking more work in house this will impact on the figures.
Another point worth noting is that significant amounts of work that the housing sector needed to do after the recession to rebuild stocks of work in progress and to get infrastructure in place on new sites. This kind of work is reined back during the recession and so with recovery we should expect a bubble of work to pass through the system as stocks are rebuilt.
There’s a fair chance that much of this repair work to the production pipeline has been done. So we should not be surprised by a levelling off or slowdown in housing-related work, even if more homes are being produced.
So while there is cause for concern over the recent data, there seems no need for panic, yet.
The forecasters foresee rising construction output over the next few years. This seems to me fair enough, even if we see a slight slump in recorded work in the short term.
But of course the other reading is that the excitement in the industry over the potential recovery has been a bit pumped up in people’s minds. The huge stimulus given to housing through, for example Help to Buy, does not provide a permanent fix. And it is the boost in house building that has so far underpinned the recovery in construction.
Historically sustained strong growth in construction has been linked to above average growth in the overall economic activity (see blog). If the next Government returned imposes tighter austerity measures, after the loosening of the grip we saw in 2012, this may lead to slower rather than faster growth in the economy.
That I suspect would constrain construction growth, however powerful the case is to refresh our nation’s infrastructure and boost the housing stock.