Just how fast is the construction industry growing?
This is a question that’s puzzling plenty of experts in the field at the moment.
The trade surveys suggest strong and continued growth. The official data suggests a slowdown recently. So let’s look at the muddle of data.
The Construction Products Association earlier this week released the latest Construction Trade Survey, which pulls together a range of survey data from material suppliers, contractors, subcontractors and small builders. Its headline said activity had increased for eight straight quarters. Most of the charts it uses point to growth, with the odd exception such as contractors’ public housing orders.
The latest monthly Markit-CIPS survey showed growth, but a slowdown in growth. The meaning is hard to ascertain as the survey has a habit of being a bit over optimistic. But a reasonable take is that it suggests we’ve hit a slight soggy patch in a generally upward path.
One indicator that probably gets less attention than it deserves is the Bank of England Agents’ Scores. These suggest that, as of March, the level of construction activity was up reasonably on a year earlier, but that growth was slower than in last autumn, suggesting a similar pattern to the Markit-CIPS survey.
The first quarter 2015 construction survey from RICS, the surveyors’ body, also suggested a slight slowdown in the rate of growth after a peak last autumn. But the rate of growth suggested by its survey remains historically high. We see a similar pattern with the survey from RIBA, the architects’ body, with the exception that its monthly measure recorded a sharp rise in March.
In terms of construction as a whole, the RICS and RIBA samples are skewed to professionals working in consultancy. Therefore this is more representative of work ahead of that which happens on the ground. So you’d be ill advised to think these data track directly with construction output. The surveys are, however, very useful in the mix. The latest ones suggest future growth and confidence among construction clients, particularly for larger new-build work.
Then there’s the official measure of construction output from ONS. This has been causing a bit of consternation as it seems to be suggesting that the industry has dipped into a technical recession. We’ll see on Friday, but early estimates for the GDP figures suggest construction output in the UK was down 2.2% quarter-on-quarter at the end of 2014 and a further 1.6% down at the start of 2015.
This leaves output in 2015 Q1 almost 1% down on output in 2014 Q1. Hence the consternation.
Now there are some issues with the data. The ONS is working on improving the deflators (the adjustments for inflation) where there are tricky problems. But working out how they might impact on the adjusted output is far from straightforward. There are problems with lags in the data. This means that what we see in the March figures may well be influenced by elements of December, January and February activity depending on how firms fill out their returns.
If you look, you’ll see that the seasonal adjustments appear to be a bit out. This is a new series (starting in 2010) and it takes time to bed down. We know this. You can’t get around it. But observation suggests the data for the summer months are a bit up and the winter a bit down on what you might expect. Crudely readjusting for this (I’m not suggesting you do, other than mentally) might roughly halve the drop we see in the latest two quarterly figures.
So a more accurate reading of the output survey data might be that the industry has been pretty flat over the past year or so.
One point I have mentioned before is that the ONS data measure work from the construction sector as it is defined. There’s plenty of construction work undertaken outside of the sector, such as in-house work by companies and other organisations. So, if over the past year, say, housing associations decided to build for themselves and not engage contractors, the ONS data ought to show a decline even if the same amount of construction work overall was being done.
I use the example of housing associations because there has been talk of such a switch being made. There is no hard evidence that I am aware of to suggest how big a shift this might be, if at all. But these are major clients of repair and maintenance work, so taking this work in house would reduce measured construction output.
Organisations taking work in house would not however alter GDP overall, as the work would be picked up elsewhere in other sectors.
All of the above is either public knowledge or you can work it out from looking closely at the figures. And ONS is addressing those issues it can.
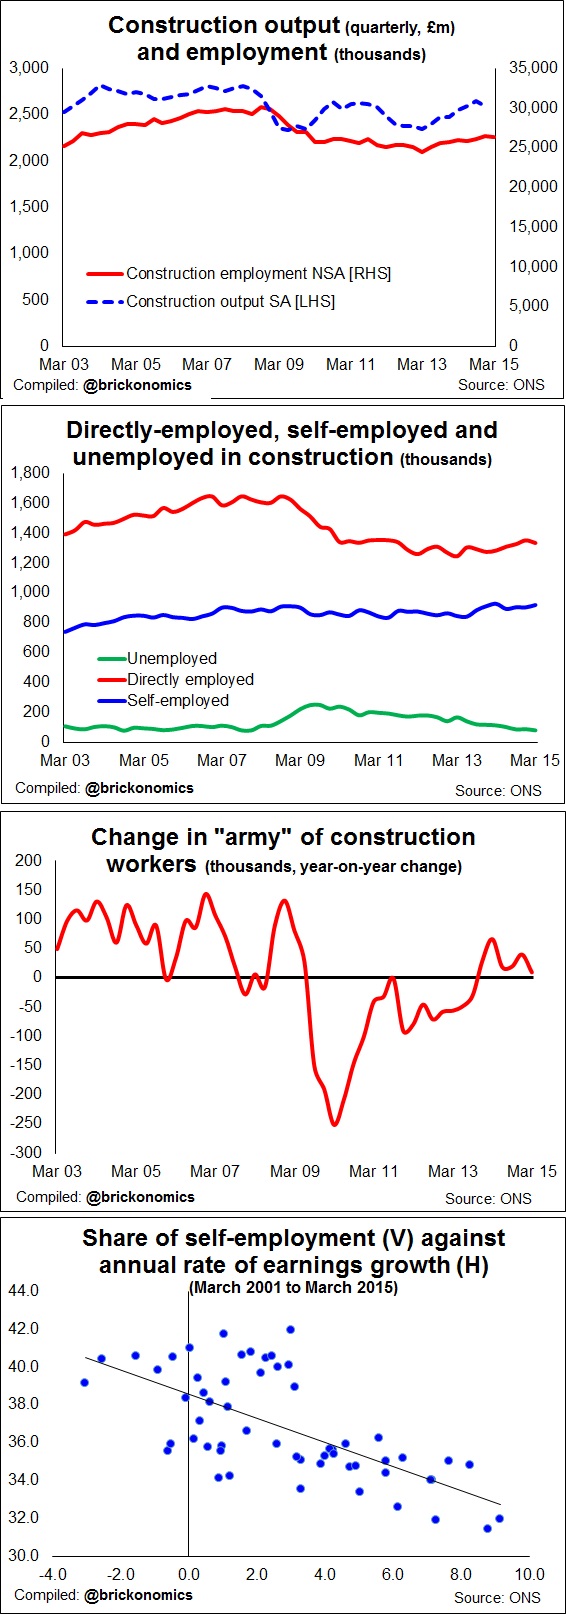 In mid-week we received the construction employment figures for the first quarter. These add yet another set of indicators to the pile. And opposite I have cast some graphs from the data.
What’s worth noting (not charted opposite) is that the message from these data is that the number of people working in construction is growing slower than across the economy as a whole.
Despite the talk within the industry of rapidly rising workloads, the number of people estimated to be working in construction in the first quarter of this year was just 1.5% up on a year ago. That compares with employment growth across the total economy of 1.9%
What’s more the average number of hours work in a week was lower at the start of this year than last. The data suggest the total number of hours worked was just 0.5% up over the year.
The data shouldn’t be seen as being totally accurate. There are plenty of vagaries. But the clear message seems to be that the total hours worked in construction in the first quarter of 2015 were much the same as for the first quarter of 2014.
Taken at face value you might read that as very slow growth in construction. That would support a position slightly closer to the ONS output position than the trade surveys.
But that would forget a few shifts that are happening within the mix of work. Notably we are seeing a shift from repair and maintenance work to new work, which is less labour intensive. So, you’d expect then that for a given amount of output you’d need fewer people.
Also there has been a drop recently in the number of women working in construction. I’d be cautious about reading too much into this. There are many ways to read this data.
One obvious take on this dispiriting asymmetric movement in the employment in construction between men and women would be that firms are cutting back on administrative roles, where women are more commonly employed. The flip side of this is that jobs on site may well have risen faster than the aggregate figures suggest.
A further queering factor we should be aware of is the influence of migrant workers. A surge in overseas workers into construction would be slow to show in the figures. There has been a tendency for the survey data to under count new migrants in the workforce. So the picture we are seeing may be behind the real curve.
Taking all the above into account it may be that there are more people employed on the ground in construction and more productively (in a very crude sense of the notion) than the figures suggest.
But however you cut it the jobs figures don’t immediately support the idea of a rapid rise in construction. Though you’d expect them to lag rather than lead the trend in activity. They also don’t support a fall.
But one thing the figures do suggest is that there is tightness in the labour market and firms are responding.
Firstly, the number of unemployed former construction workers is at a historic low. Over the past 20 years there has been just one other quarter when the figures suggest unemployment was lower than the current 80,000 count. Secondly, we are seeing a shift back from self-employment to direct-employment.
Self-employment is down on a year ago. Direct-employment has risen moderately strongly. The bottom graph suggests that this could be both a response to fears over shortages and a response to rising wages associated with the boot now being more firmly on the foot of the worker rather than the employer.
So adding up all the above, just how fast is construction activity growing?
For my money I’d be cautious about being too precise. There will have been a surge in work associated with restocking. This kicked off when the Government chose to boost the economy as it flagged in 2012, through such moves as Funding for Lending and Help to Buy.
The increase in stocks is noticeable particularly in the accounts of house builders, where there is a higher level of work in progress. As that restocking surge, which seems to have kicked off late 2012 early 2013, weakens we should expect a slowdown in growth.
This does not mean that the industry is slowing in a general sense. Things are broadly on the up. But there is one big problem, the supply side and in particular skills.
We spent five or six years, needlessly in my view, depleting the supply side of the industry.
We will pay a high price for that. And for me at least it rather taints the pleasure of seeing more cash finally being invested in the built environment.
PS: I forgot to add in the BIS building materials data which shows, among other things, brick and block deliveries and production. Worth noting the easing in brick deliveries over recent months.