Finding the value in construction
Few would deny that construction is vital, but inside the industry many believe it is grossly undervalued.
If they’re right, it raises two interesting questions. Is there a definitive figure that fairly expresses the value construction delivers? Does it matter if there isn’t?
The second question is easily answered. Yes, it matters. In a complex world simple messages cut through. Having readymade convincing statistics is a boon.
The answer to the first question is trickier. But it’s no, even though you might argue technically the case for using the National Statistics measure for gross value added by construction – £111 billion or thereabouts in 2017 (about 6% of the UK economy).
If not GVA, then what is the value?
There’s the rub. It all depends, for two good reasons.
Firstly, the industrial classification used by statisticians is increasingly regarded as unhelpful. Secondly, the industry doesn’t capture many costs and benefits it generates, so they are not recorded in the data.
To fix on a more helpful measure you first need to recast the definition of construction. Then you need to assess how much value that construction generates is not captured by the industry.
The case for redefining construction is powerful. National statistics define it very narrowly, roughly to activities on construction sites. Most professional firms of architects, engineers, quantity surveyors and other related professions aren’t counted. Construction materials used are included in ONS construction output figures but not in national accounts figures for value added.
The classification of construction, as it stands, doesn’t comfortably reflect how the industry operates or sees itself. And it’s likely to become less relevant as more activity shifts off site to manufacturing and professionals.
Table 1 seeks to illustrate how ONS defines construction with how the industry might see it.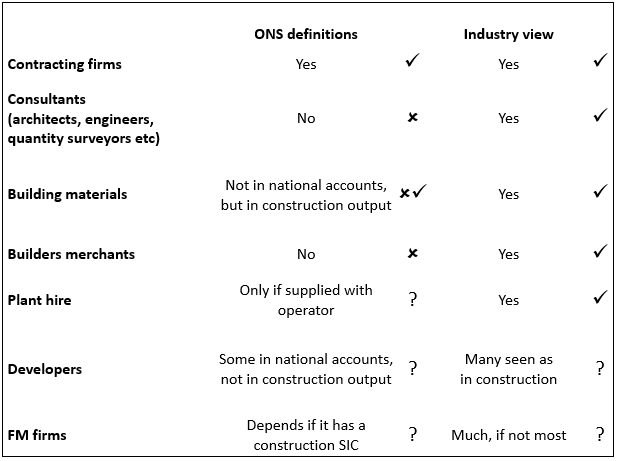
Under the narrow definition construction has accounted for about 5% to 7% of UK economic activity for decades (see in Chart 1). But a broader definition can suggest an industry about twice as large.
That’s not to blame ONS. It’s not just a UK issue. Gerard de Valence of the University of Technology Sydney and Honorary Senior Lecturer at UCL’s Bartlett School took Australian data and produced results showing construction, narrowly defined, accounted for 10.8% of non-government sector output, with a broader defined construction sector accounting for 21%.
To date, there are no official figures tracking such a broader sector that might better reflect construction as a functioning integrated industry. There have been calls for ONS to produce satellite accounts, like those prepared for tourism. Such accounts consolidate, from standard classifications, related activities on a consistent basis.
Turning from definitions to address issue of value capture we confront at least two challenges. The first is what value we’re talking about. Should we simply measure economic value or include social and environmental value?
The second relates to how the market works and the business models available to capture the value generated. If construction operated in a stylised perfect market its economic value would be more fairly reflected in its prices and level of production, and so in its gross value added.
There’s currently much debate about how we measure value economically. In part this is because the systems used were developed in an age when manufacturing was dominant.
In the UK and many more-developed economies, manufacturing producing tangible products has made way for an expanding service economy delivering less-tangible outputs.
Putting this trend into perspective, Chart 1 shows the long-term UK economic trend from manufacturing to services.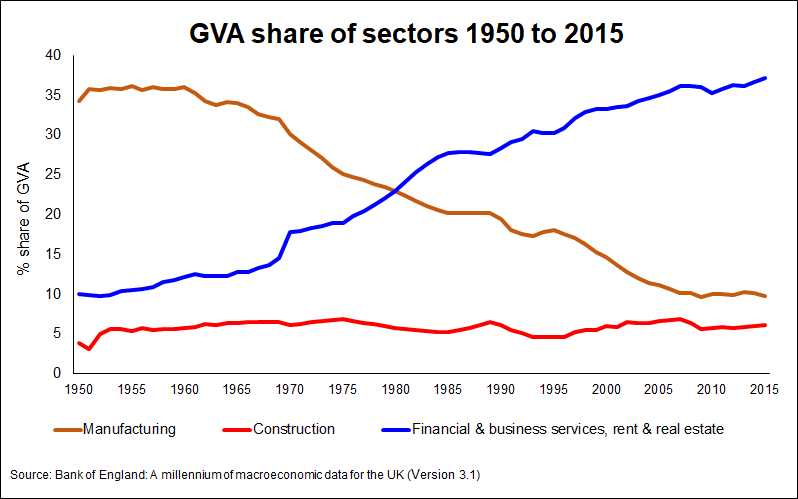 Given that the methods of measuring economic value were designed for a manufacturing-based economy, do existing rules still apply? Does GDP and GVA provide an adequate gauge of a nation’s success? Does it provide a sound framework to assess the value of construction?
Leaving wider philosophical points aside, there’s a more immediate impediment to gaining a clearer understanding of construction’s true economic value, as might be measured by gross value added. Much of the value created by construction – and those investing in it – is not captured in the market. Spillovers or externalities (where one person benefits or loses incidentally from the actions of another) are commonplace in construction.
Some externalities are accounted for in some way – but many are not. Should we ignore this value, positive or negative?
Construction externalities can be huge, often a result of buildings and structures being fixed in location. This means they influence the value of surrounding land, often not owned by the developer or contractor, which makes capturing any land value uplift difficult. In this light it is easy to see why so much infrastructure, delivering significant wider public benefits, ends up publicly financed.
A report by Transport for London looked at how to capture substantial value from the land uplift created by constructing eight prospective projects. The total cost was £36 billion. TfL estimated the land value uplift at £87 billion. TfL may capture some of that £87 billion, but ultimately many London landowners will see windfalls as the value of their land rises.
With such large externalities at play, impacting society, other businesses and the environment, the value construction brings is not simply an economic issue. It’s social and political, with construction generating huge value (positive and negative) that is not measured in the market.
And there are practical benefits in isolating where construction might add non-market value. It highlights potential areas for social funding. For example, the 2016 BRE Trust report The full cost of poor housing estimated poor quality homes in England cost the NHS £1.4 billion a year from injuries and illness. It put the wider social cost at 18.6 billion a year.
Time plays odd tricks with the value of buildings too. Despite deteriorating fabric, the value of most buildings rises with age as their locations and the land they are on become more desirable.
It’s not always down to rising land value. Time and changing circumstances play another less definable role. Consider the Eiffel Tower – a temporary structure to be dismantled after 20 years, built in the face of heavy criticism. More than 130 years on, it’s a national icon, having attracted 250 million visitors. What value do we put on that?
This relationship with time as well as location raises tricky questions, given very long lifespans and changes of use over time. For instance, how well we factor the passage of time into today’s decisions about what we do and don’t build?
Pinning down a near perfect assessment of the real value construction adds may be out of reach. But developing a better understanding would improve the choices we make.
So, what can we do to craft more meaningful numbers that better reflect the value of construction?
Two things would help.
Firstly, regular trusted accounts that embrace the industry more appropriately –satellite accounts as mentioned above. This would not only reveal construction as a significantly larger economic activity than the official statistics suggest, but it would provide better data to gauge progress of construction as a more integrated industry.
Secondly, more research and collating information on the wider social, economic and environmental impacts – positive and negative – of construction.
In a 1943 parliamentary debate on rebuilding the House of Commons after being bombed in 1941, Churchill said: “We shape our buildings and, afterwards, our buildings shape us.”
If that is true, we need to shape our buildings and structure, indeed the whole built environment, for the better. To do this we need a clearer understanding of how construction delivers value.