Why the lag in construction output data may be more important than the ONS seems to suggest
The Office for National Statistics today released analysis that says the lag between recorded and actual construction output is 0.24 weeks.
If the lag really is less than two days, the ONS would appear to be sensible to do what it has done, the pragmatic thing, ignore it.
But is the analysis really convincing?
Well not for me, having read it this morning, and I am not alone in my concerns.
I don’t know if there is or is not a lag. I suspect there is and I suspect it is variable between companies and over time and so is hard to predict or adjust for.
I also suspect that in some circumstances it may have a far more profound impact than the 0.24 weeks figure suggests.
More importantly I believe that reducing the lag to a weighted average time is inappropriate as I will argue later.
In the broad scheme of things a lag in the data isn’t a matter of life or death. But if you are aware of the possibility or probability of a lag it does help in better understanding what is actually happening on the ground.
It’s nice to know that January’s output figure tells you about what is going on in January rather than what is going on mostly in January but also to some extent what happened in December.
Anyway, for the record here are my understanding of and concerns with the ONS analysis.
ONS contacted 395 companies by phone and elicited responses from 187, a shade fewer than half.
I haven’t seen the actual questions asked and I don’t know whether these are exactly the same as those shown in the analysis. Also I haven’t seen any details of the surveyors’ script concerning any prompts used or stylised answers to deal with queries by the respondents.
So I can’t know if any important issues were missed or whether the survey might have, in itself, led to misinterpretation.
I don’t know how the 395 companies were selected. I hope and suspect they were selected randomly, although I didn’t see the word used in the report.
But one immediate concern I do have is that those of the near 400 who responded are potentially (human nature being what it is) the more conscientious among the construction fraternity. So I think to myself, is there bias here?
These are just the worries of a fevered brain, so on to what the survey found.
The findings showed that a narrow majority of firms filling in the survey tended to use invoices raised to measure the work done in a given month. This is very much what was expected.
A couple of firms used orders (very worrying, but fortunately a small proportion), about 30% said they worked out what work was actually done in the reference month and 16% said they put down a figure for turnover on the basis of invoices paid.
What the survey did find was that about a quarter of the sample said that the work they put down for the reference month was not actually all done in that month.
So the survey appears to have found that there is a lag with the data provided by a fair proportion of respondents.
To assess how much of a lag there might be these firms were then asked to come up with a figure for how much lag there was in weeks between when the work was done and the period it was recorded in.
What we end up with is a picture that shows about 10% of the overall sample reckon there is a lag of about one to two weeks, 9% or so reckon their data lags by about three to four weeks and a further 4% or so reckon they are putting in the details for work done six or more weeks before the reference month.
Broadly speaking the percentages here are a bit ropey as when we start to get to this level within the sample the range of possible error is pretty large. But what we see is that there is quite a bit of lag in the reporting system, with the analysis suggesting a lag in almost a quarter of the firms responding to the construction output survey. And the lags are pretty varied.
The analysis seems to suggest that more than 20% of firms report output two or more weeks late in relation to the reference period.
In fairness these are weighted towards the smaller firms, so it is possible that we are not talking here about a quarter of the total output recorded being recorded outside the reference period.
Before I explain why it is (at least in my view) inappropriate to use the measure of an “average” lag (the 0.24 weeks figure) as a test of whether a lag has significant impact on the figures or not, there is a potential snag or two in the survey that is nagging in the back of my brain.
Let’s look at how things happen on the ground, at least as I understand things.
Work is not always measured in precise calendar months. While payment to exact calendar months may prevail (they may not, I don’t know), the payment dates for a job may start on any given day in a month.
So January’s payment might be up to the 20th say with the February payment starting on January 21st.
Now the survey found 98 out of the 187 respondents said they used invoices raised as a measure of work done. That’s more than half.
Do any of these firms really unpick these invoices and allocate accurately that which is attributable to each reference month?
I’d hate to tell you what I am told by those on the ground about the accuracy with which they apply themselves to this task, but it’s not encouraging.
I suspect that if the invoice says “January” then it is in the January pot for the ONS survey. That means anything dated January 1 to January 31.
I merely speculate here, but this all smells of a lag potentially bigger and more widespread than the one suggested by the analysis.
One other point that struck me concerns those firms that used invoices paid to calculate work done. Quite rightly ONS points out that they tend to be smaller firms. But there is an assertion that payment is made in the same period as the work is done because the projects are of very short duration.
This I have to query. Late payment is, as far as I have been led to believe, still a major issue.
This again points to the possibility of a bigger lag.
How well these issues were picked up in the survey I don’t know, but I harbour suspicions that the amount of lag may well be larger than the survey results suggest.
But I hasten to add I am just speculating here.
Now to my concerns over the distillation of this data into an “average” lag and why this is not in my view a smart way to look at the problem.
What the ONS did was to provide a weighted average lag from the figures. It comes out at 0.24 weeks, or about a day and a third.
There doesn’t appear from that to be a problem then.
But to me this is a very odd way to look at the impact of a lag, particularly as the lag is clearly not consistent across all those who fill in the forms sent out.
To illustrate this point I have put together a stylised example of how a lag in a proportion of the data might impact on the final figures and how this might hinder interpretation.
(Please scream at me if I have made any errors, I have had to knock this out a bit quickly and have not had someone to check the numbers for me, so apologies in advance if they are needed.)
I have chosen to use figures for 25% of the sample being lagged by one month. I have assumed in a normal year all monthly figures are 100. But in a weather-impacted year the figure for December falls 20% below normal.
Here are the figures:
| October | November | December | January | February | |
| Actual in normal year | 100 | 100 | 100 | 100 | 100 |
| Properly allocated | 100 x 75 | 100 x 75 | 100 x 75 | 100 x 75 | |
| 25% lagged by a month | 100 x 25 | 100 x 25 | 100 x 25 | 100 x 25 | |
| Recorded in normal year | 100 | 100 | 100 | 100 | |
| Actual in weather impacted year | 100 | 100 | 80 | 100 | 100 |
| Properly allocated | 100 x 75 | 80 x 75 | 100 x 75 | 100 x 75 | |
| 25% lagged by a month | 100 x 25 | 100 x 25 | 80 x 25 | 100 x 25 | |
| Recorded in weather impacted year | 100 | 100 | 85 | 95 | 100 |
| Error % | 0.00 | 0.00 | 6.25 | -5.00 | 0.00 |
| Actual growth rates % | 0.00 | 0.00 | -20.00 | 25.00 | 0.00 |
| Recorded growth rates % | 0.00 | 0.00 | -15.00 | 11.76 | 5.26 |
Here are the accompanying graphs:
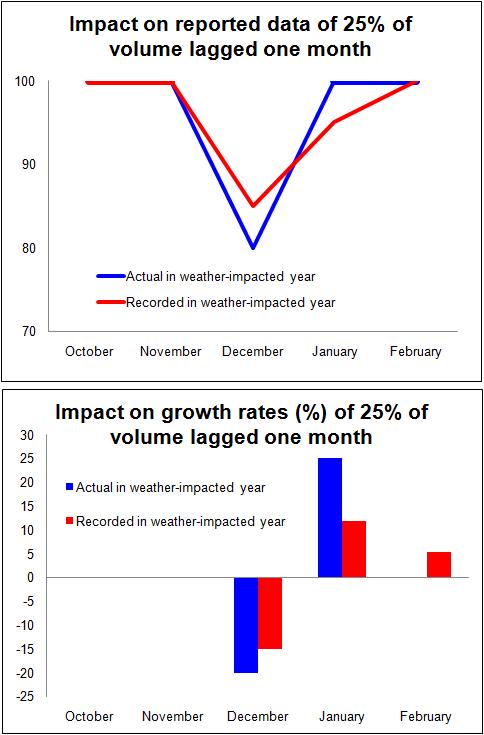 What we see is that there is a significant error in the December and January figures (+6.25% and -5% respectively). This could easily mislead interpretation.
Both the level and growth rates are noticeably impacted as the graphs illustrate. Furthermore, because this effect happens across years, the output figure for the weather-affected year is up about half a percent and the following year is down roughly half a percent. The net effect is that the growth rate from year one to year two is shifted from 1.7% to 0.8%.
Furthermore it is important to recognise that even if the significant part of the lagged data were lagged by, say, two weeks and not a whole month, if an unusual event happens in the final two weeks of the month, the impact will be felt in the next month’s recorded data.
In my view to reduce the lag to a weighted average is to underplay the potential impact in critical cases.
Just for fun I took the existing current price data and then adjusted it on the assumption that the recorded figure consisted of 70% of the actual figure for the month and 30% of the previous month’s actual figure (so, FebR = 0.7 x FebA + 0.3 x JanA).
This would be to assume that there is a one month lag in 30% of reported volume.
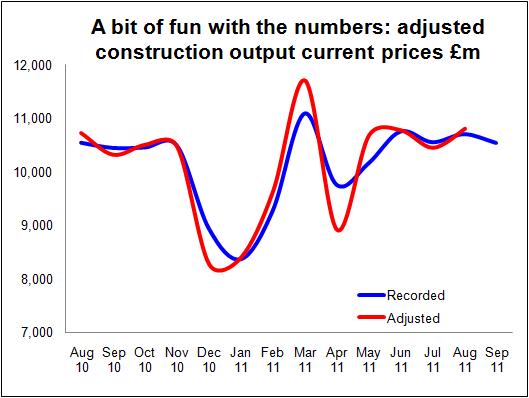 The graph is quite interesting as it show output in December 2010 a shade lower than in January 2011. And if there is anything in this, it is possible that the Royal Wedding also had a bigger impact than the official figures show.
Now I am not painting this as a more accurate picture of what is going on, just illustrating how sensitive the figures can be to lags.
But to summarise, firstly, I fear the lag could possibly be greater than the analysis suggests. Secondly, I think that even if it is not, the impact on the output data is potentially far greater than the average weighted lag would suggest.
When construction output is hit hard by big events, such as blizzards, the fact that only 20% or 30% of this effect is being carried forward does not stop the data series being greatly impacted.
To be clear, I am not suggesting that the ONS needs to radically alter its processes or reschedule its time frames or need look at correctives to adjust for the impact of any lags there may be. In normal circumstances the impact may not be that relevant.
But the potential distortion of variable lags within the data should not, in my opinion, be ignored.