Questioning data, questioning the value of data, glasshouses and stones
Last week’s ONS construction data release caused a few ripples when it showed output dipping in August.
It also sparked some sharp criticism from Chris Williamson, chief economist at Markit – the people that bring you the PMI surveys.
The second paragraph of his commentary reads: “We question the value of the official construction data due to the scale of revisions that occur after data are first release. The signals about the health of the sector and the economy as a whole can be utterly misleading as a result.”
I’m no shrinking violet when it comes to criticising statistics. But I wondered whether the comment was fair, balance or constructive. So is it?
The ONS release suggested a drop in output of 3.9% in August compared with July and a drop of 0.3% comparing August 2014 with August 2013.
It also showed a 5.5% dip in private housing between July and August, which surprised a few people.
 For me there was no great surprise in the figures. Mind you, I wouldn’t have been shocked if the monthly figure went up. It’s an early estimate of one month’s data on the level of construction in various sectors. It is not a snapshot indicator of sentiment.
August was a bit wetter than usual, so it may have dampened output. The industry is in a state of change so volatility is expected. This is particularly true of house builders as they restock their production pipelines. Even when the construction industry is on a reasonably even keel the data are volatile.
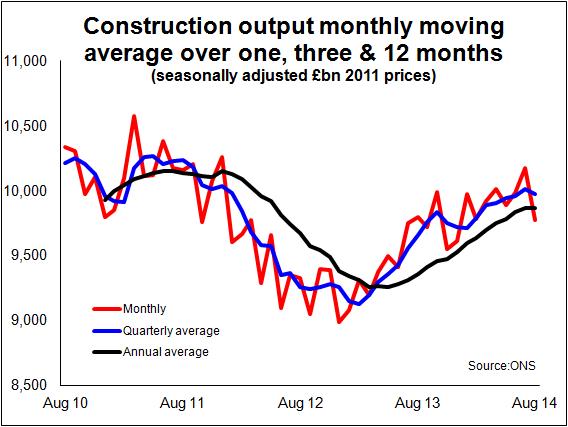
Looking at average of output over three months probably gives a better picture. The three months to August showed growth of 1% on the previous three months 5.3% on a year ago. So the data clearly suggest underlying growth, with a possible hint at a easing in the growth rate of late. That is all clear from the top graph, which illustrates the volatility of monthly data.
Should you always expect to be going upward when you’re climbing a mountain? I don’t, not that I climb that many mountains.
What’s more would I, if I were running a construction-related business, be reliant on updates on the level of production at a GB aggregate level to a high degree of accuracy on a monthly basis? Well probably not. A general sense of where things are going at an aggregate level from a few sources will do fine, even if they are contradictory, along with a damn good detailed understanding of my particular markets. So what’s the problem?
What about the issue of revisions? They were pretty big this time around.
Revisions are a pain. But then again not revising the past when you learn that you misrepresented it (absolutely or relatively) presents its own issues, particularly if your information customer is me – someone who likes long data series with as much consistency as you can muster.
The scale of revisions we are told was partly down to a number of technical things, such as re-referencing the indices to 2011=100 to align with the National Accounts outputs and seasonal adjustment methods in the new processing system, plus the usual adjustments made to incorporate late data.
If you imagine all the elements that feed into or are related to the National Accounts as a huge multidimensional jigsaw that has to be, as far as possible, internally consistent, revisions are inevitable. When one bit moves others have to move.
Annoying as they are, I’ve learned to accept the regular revisions. Oddly, the upside is that in some odd way they seem to give me a better understanding of the strengths and weaknesses of the series.
To my mind, ultimately, all construction data are iffy. It’s just a question of how iffy and why.
Construction is a highly complicated industry to capture with simple measures. The projects are lumpy and extremely heterogeneous. The sectors are variable and hazy. The firms are all different shapes, sizes with very variable mixes of work.
Finding a neat way to capture all that in a few simple indicators presents the surveyor and statistician with a nasty task. Trying to get an accurate gauge on the precise level at any one time is even more devilish.
That’s what the ONS seeks to do with the construction output figures. For me, at least, it is less a short-term measure of direction of change than a useful gauge of level over time.
My approach on short-term trends tends to be to use what might be described as triangulation. I look at many surveys (including the ONS construction output and orders), assess as best I can how they match and how they conflict. I question their individual weaknesses and I try to assess how they fit with the broader context.
The Guardian used to run ads suggesting that it, as a newspaper, looked beyond the meaning one might ascribe to one observation and took in the bigger picture before seeking to interpret what was actually happening.
The first clip might show a dodgy looking fellow pushing an old lady. Your immediate thought was “mugger”. The second clip (the reveal) would then show the “thug” bravely pushing the vulnerable lady away from falling bricks. Ah, not a thug, but a hero.
Context is all, beware cognitive bias, etc, etc.
As with people’s intentions, we can read data and get the meaning completely upside down.
A lesson I learned long ago was to question all data. When seeking meaning from data it’s worth bearing in mind among other things, how they were collected, the assumptions in the methodology, the survey size, the motives of the respondents, how the survey data is translated into an estimate of volume or change, the impact and treatment of occasional factors, weights and price or seasonal adjustments.
You then have to look out of the window, away from the spreadsheet at the real world.
With these thoughts in mind let’s question the construction survey produced by Mr Williamson’s firm, Markit.
To provide comparison and a bit of context I have compared the Markit/CIPS construction survey headline indicator with the monthly construction survey provided by the Bank of England Agents.
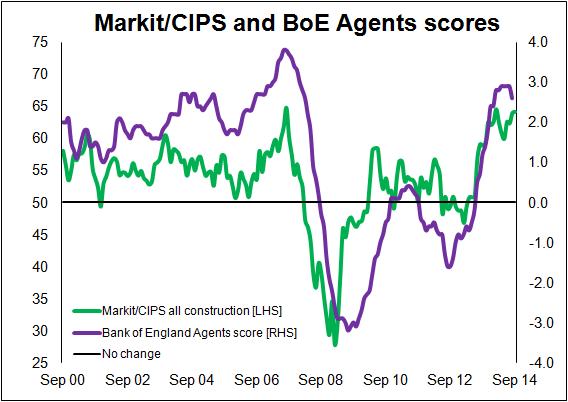 What we notice is that since March 2010 the construction industry has grown on the Markit measure in 47 out of 55 months. However, when there has been a slowdown recorded it has been relatively slight. The Bank of England Agents however did not measure growth until November 2010. They then recorded a slump from October 2011 through to June 2013 (21 months).
If we take the period March 2010 to March 2013 the average Markit/CIPS score is 52.6 (suggestive of sound growth) against the average for the Bank of England Agents of -0.6 (suggestive of modest decline).
I will leave those in the industry to decide which they feel provides the more representative depiction of their interpretation of the path of GB construction.
I will however draw from an unrelated dataset, employment. Between March 2010 and March 2013 100,000 jobs were lost to the industry, that’s almost 5%. Now that could happen with an expanding industry. But it would be unusual for construction, particularly as the more labour-intensive repair and maintenance work seems to have been stronger than the less labour-intensive new-build work over the period.
I’ll not go into the potential methodological issues with Markit’s measure in any detail. I can’t. I’ve asked in the past for a full rundown of the methodology. I don’t recall receiving it.
I have a couple of outside observations though, I’d need to be convinced that procurement directors are necessarily the best placed to gauge business activity within construction (some may well be) and I would instinctively be wary over the PMI sample size given the heterogeneity and the muddled regional spread of construction firms.
Interestingly, I have found the ONS transparent and open to and accepting of criticism over its construction data. The statisticians and their approaches come in for regular scrutiny at the Consultative Committee on Construction Industry Statistics, not least from me. I can see it hurts them at a personal level. But that is the price we pay when we accept our mistakes as we try to get things right.
That brings me to glasshouses. Ideally they are great for transparency. Not so good a place in which to throw stones.