Is the deep-seated problem of housing supply really just about planning?
Does constraint on planning approvals restrict the supply of homes or does the demand for homes determine the level of planning approvals? Perhaps both work in tandem or parallel.
These questions have bugged me for years.
Here’s some fresh thought prompted by the release of the latest house-building figures and, in part, by concerns expressed over the weekend by Bank of England Governor Mark Carney about “a housing market that has deep, deep structural problems”.
The housing market is a complex system shaped by numerous factors often acting paradoxically. Planning laws shape the housing landscape. That’s the aim. But is planning really the overriding reason we don’t build enough homes in England and why they are so poorly distributed?
Planning’s central role in the housing debate is seldom challenged, though more so recently. It dominates the narrative in housing policy in England, which says restrictive legislation is why we build too few homes.
Policy makers recognise other factors, such as tight lending and the hefty deposits, choke demand and slow private house building. Hence Help to Buy and other variations on a demand-enhancing theme. But these are short-term measures to fix short-term market failures.
The collective brain of policy makers, supported by many academics and commentators, believes: “Fix planning and we fix the dysfunctional English housing market”.
What if planning isn’t the main problem?
If childhood taught me one thing it was the need to ask everyday whether the Emperor is wearing clothes. So let’s ask: is planning the root cause of England’s housing market ills?
Certainly I’m impressed by research showing the potency of planning restraint in shaping the English market. I’m convinced that planning is a factor in the mix.
I’m less convinced by a slavish acceptance that because it frustrates business it must be the problem.
Of course it restricts business. That’s its purpose. The alternative, no planning restrictions, would destroy economic and social value.
Anyway, here are a few charts drawing on the latest housing starts and completions figures and some statistics on planning and residential property transactions.
Some of what I’ll illustrate readers of brickonomics will have seen before, possibly a few times and I’ll warn now they pose more questions than they answer.
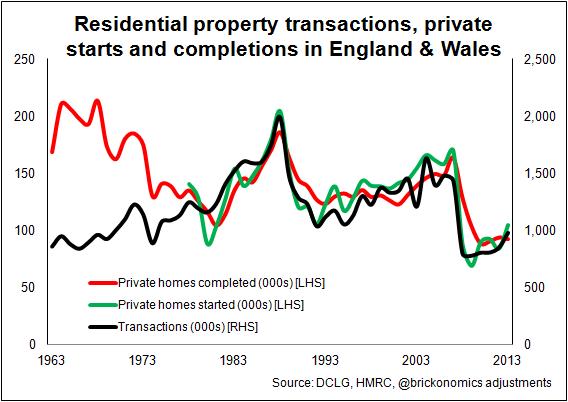 My favourite graph, one I’ve pumped out for years in the vain hope someone will explain it’s true meaning. It illustrates one of the closest relationships in the housing market. Sadly it’s one of the least studied close relationships I know.
Private housing starts and completions track property transactions remarkably. Crudely interpreted it suggests that across England as a whole since the late 1970s for every 10 homes sold one is a new build.
Nationally, house builders take a consistent share of the overall home sales and have done for years. The data also suggest house builders respond to changes in the level of transactions, rather than the other way around.
Fascinating, but so what? Well it poses a number of questions.
Firstly what happened in the late 1970s and early 1980s to cement this relationship?
Secondly, what drives this relationship? Coincidence seems far-fetched.
Thirdly, if house builders always build a 10% share of the homes sold, how does planning fit into all of this? How might a planning decision in Rotherham that leads to a development of 100 homes prompt 1,000 households in England to buy homes?
OK, that’s silly, but where’s the causal link here?
More importantly it suggests that if we want to boost private-sector house building all we need to do is boost transactions, encourage more homeowners to move house more often. (Note with fewer homeowners and the problem gets worse.)
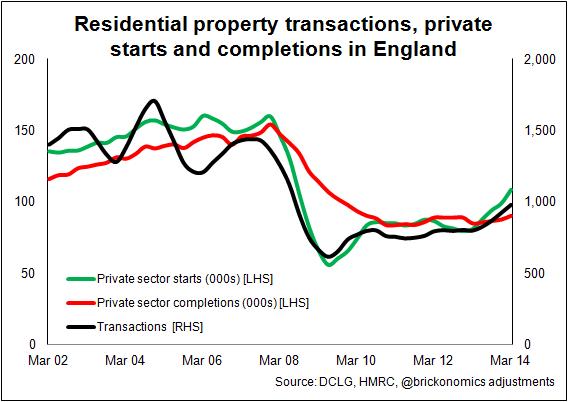 The second graph zooms in, using four quarter moving totals. It shows the lead up to the crash, the recession and the recovery.
We see wobbles in transactions in the 2003 to 2005 period with lesser wobbles in starts. Then, when transactions fall in 2007, starts plunge shortly after. No shock there. The best fit correlation suggests starts lag transactions by about 6 months.
Interestingly coming out of the recession starts seem to run ahead of transactions, although the number of home completions continues to lag. This seems to suggest again that house builders respond to market demand in a way that maintains the 10% market share.
This market share fluctuates and is also not even across England. Even so, for more than 30 years the relationship has held remarkably close to one in ten.
Let’s look at planning approvals. DCLG data are pretty dirty. The department doesn’t provide good statistical time series for planning. I’ve put the third graph together using quarterly individual releases. (I’ve produced a similar time series using Barbour ABI planning applications data, the key point is probably better made with that.) But for this blog I chose to use official data sources that can be easily accessed and checked.
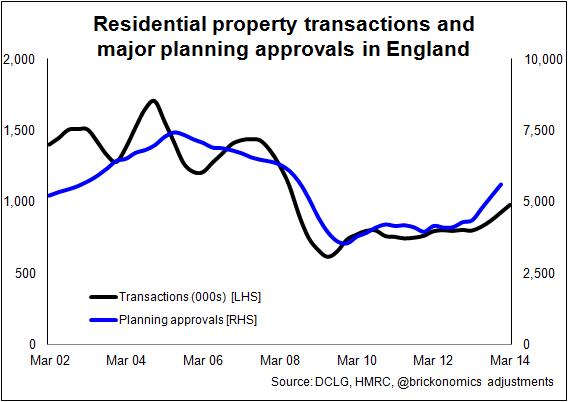 The immediate question that springs from the graph is: if access to land with permissions was the big problem in the mid 2000s, why did house builders’ appetite seem to wane in 2005? Why did they put in fewer applications?
The pressure to boost house building was at a high, especially following the Barker report. Why was the tap turned down on the pipeline filling the stock of land with planning? Planning approvals fell from mid 2005, before plunging in late 2007.
Were developers responding to falls or a fear of fall in demand even in 2005? Certainly transactions dipped and so did house-builders’ reservations. Were developers spooked? If so we see again planning following demand, rather than supply following planning.
But then again, the mid 2000s was a period of extraordinary corporate activity in the sector, with major mergers and acquisitions, whereby individual house builders expanded landbanks through acquisition. Did this deflect them from seeking planning permissions? Were developers, at a corporate level, so frustrated with planning restrictiveness they chose to buy “oven-ready” land rather than battle planning authorities?
If we look at the period 2008 to 2012 what do we see? A significantly lower level of planning approvals than previously. Is this related to effective housing demand or planning restrictiveness? The former, surely?
Moving forward to the near present, we see a surge in approvals, albeit from a low base. What lies behind this?
It can be read in a number of ways. The Government would like us to read the data as saying the rise is down to its fundamental shakeup in the planning regime. It may be.
There’s of course an alternative reading. House builders seeking to increase their land supply in anticipation of a rise in future sales. The data clearly show rising planning approvals running ahead of transactions.
It’s unlikely that a rise in planning approvals prompted a spurt in householders moving. So we must assume we are seeing growing house-builder confidence and anticipation of a rising market.
There’s another explanation. The NPPF (National Planning Policy Framework) created an opportunity for developers to more easily win planning permissions through appeal against local authorities without an agreed Local Plan with a five-year land supply. Are they simply taking advantage of this once-in-a-planning-regime-change opportunity?
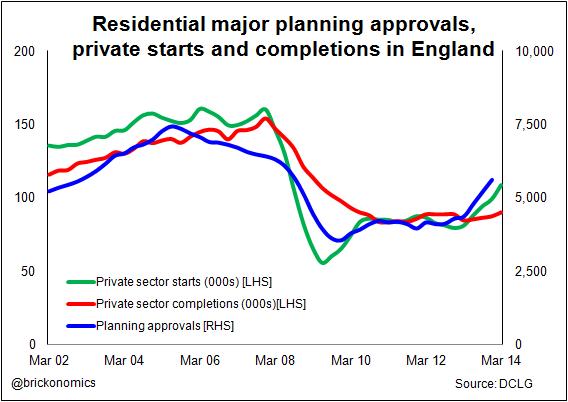 What we see in the fourth graph is how, recently, starts have increased after a rise in planning approvals. This suggests that house builders may well have been held back recently from expanding their operations faster for want of permissioned land. Note that the data show that the level of completions has been much slower to respond. But this does seem to support house-builders’ case (but not prove), that they are not gratuitously landbanking, as is the accusation in some quarters.
We also need to consider the restocking effect. Not only are house builder having to increase land supply to accommodate a rising replacement rate, they also have to increase the land within the production pipeline. Periods of rapid expansion can cause surges earlier in the production process that are not seen in the later stages.
Pinning down the cause of the rise in planning approvals is not easy given the timing. What’s down to the new planning regime? What’s down to increased demand?
What we can know is that the level of planning approvals as of the end of last year was still way down on the pre-recession level, even the best part of two years after the introduction of NPPF.
It is tempting to see the blue line in the fourth graph as suggesting that the NPPF has made the planning system more amenable to developers and led to this rise in approvals. Developers might, and do, say so.
The data, however, are far less clear. Worse still, the measures are awkward and very open to misinterpretation, given the complexity of timings and outcomes in planning decision making.
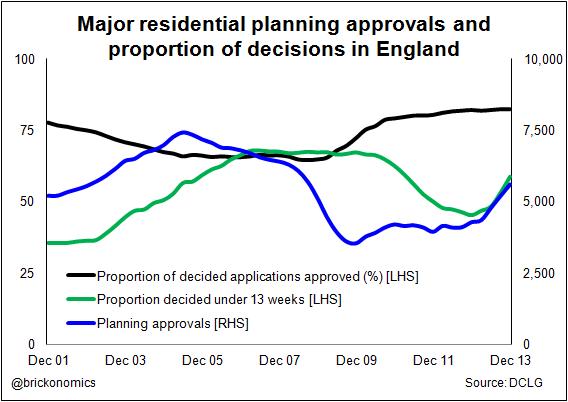 Let’s have a look anyway. The fifth graph plots planning approvals (four-quarter moving total) against the proportions of decisions made within 13 weeks and the proportion of those decided that are approved (four-quarter moving average).
Certainly on this showing things seem more free-flowing than in the past. The proportion of positive decisions has risen. But, of note, this rise came as the number of applications fell.
Again, there are a number of possible explanations. Maybe house builders pulled away from more controversial schemes. Maybe fewer applications reduced the political pressure on planning authorities to reject applications. Perhaps house builders improved their consultative skills with both the planning authorities and their communities.
What is clear, given the relatively high proportion of approvals is broadly the same as it was before NPPF, is that we have little evidence on this measure of a more permissive planning environment.
The intriguing correlation is that between the increase in approvals and the increase in approvals taking less than 13 weeks. Is this a reflection of a more effective planning regime? Or are house builders working harder to push through planning applications?
Taking all of these time series together the weight of evidence seems to point to the causal links running from market demand to planning approvals and then, inevitably, to the supply of new homes. The more demand in the market, the more house builders seek planning permissions, the more they build.
This, at face value, seems to dilute the strength of the widely-held view that the supply of new homes is limited by the planning system.
It suggests that to improve the supply of new homes we need to increase demand for new homes. This in turn seems to suggest (given the ratio of one new home sold for every 10 homes bought) the need to get more homeowners moving more often.
If we can’t? Well, that would point to a market failure and the need for state intervention.
Those who believe fervently planning is the central problem would argue that the balance of demand for new homes over existing homes would shift if developers were freer to build where demand is greatest. Perhaps, maybe house builders might increase to a ratio of two new homes sold for every ten house sales.
But as we keep saying the housing market is a complex system, with weirdly unpredictable interactions, reactions and feedback loops.
So, for instance, we should accept that a restrictive planning regime would almost inevitably create a context over time within which house-building firms operate in a particular fashion. Restrictive planning would also create a market over time within which home buyers behave in a particular fashion.
What’s more we’ve ignored other obvious critical actors, such land owners. How do planning restrictiveness, market demand, the level, quality, desirability and availability of existing stock and developer behaviour influence the land price, land-owners expectations and their willingness to sell at a price that ensures sufficient supply? It could be argued strongly that the real competition in house building, as our system currently operates, takes place in the land market.
Even stripped down to the few variables we considered above, its very tricky to establish what weight to ascribe to planning restrictiveness and what weight to ascribe to house-builders’ operational behaviour or demand (effective or potential) from home buyers.
One thing I am convinced of: policy makers need to broaden their curiosity and extend their debate on the housing market and house building. Obsessing about and demonising dysfunctional planning systems, faceless bureaucratic planners, “landbanking” house builders and the archetypal nimby may well be popular, but it’s high time we put more effort into exploring the problems more widely.