The implications of falling homeownership on private house building
Whatever view you take of homeownership it has a powerful influence on how the economy functions and on the type and number of homes that get built.
Rapidly growing homeownership in the 1930s and again in the 1950s and 60s corresponded with big surges in private sector house building, particularly in England.
(I apologise, but this piece will be mainly based on English data, although not exclusively)
But I’m increasingly convinced that it’s not just the level of homeownership or its rate of growth that influences the number of private homes built, but how often private homes (new and existing) are traded.
The top graph shows the level of residential transactions and how it compares with the numbers of homes completed in the private sector in England and Wales over the past 50 years.
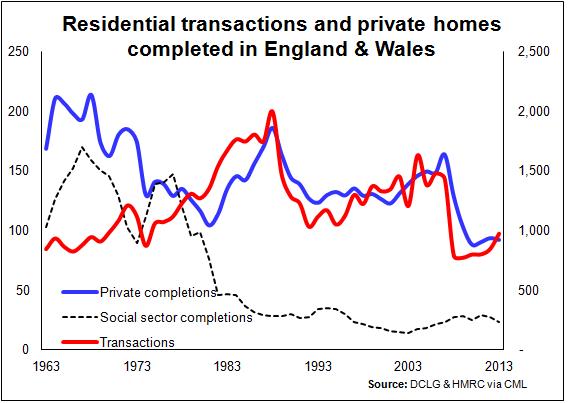 From about the mid to late 1970s what to me is an extraordinary close link has formed between how many homes are traded (residential transactions) and how many private new homes are sold (private housing completions).
As you can see the link is fairly stable at a level that suggests approximately (on these figures) that for each 10 homes traded one is a private new home.
If we test for a lag in the series we can also see that it suggests builders are following the wider market rather than the other way around.
I’ll not speculate at this point on why a relationship formed in the 1970s, but the data suggest one did form. I could provide possible explanations for this including the role that the residual land value model might play. But that is, perhaps, for another time.
For now the key point is that there appears to have been for almost 40 years a strong link between how many second-hand homes are bought and sold and how many new homes are bought and sold.
This is, in my view, critically important in helping to understand the current levels of house building.
So from this we can reasonably expect there to be a link between how often people move and how many new homes are built. This link will be a bit less direct as, for instance, sales of homes to investors and second-home owners will cloud the picture.
But given the majority of homes are sold to moving owner occupiers and first-time buyers, a link should be evident. And we see in the second graph that the link does hold.
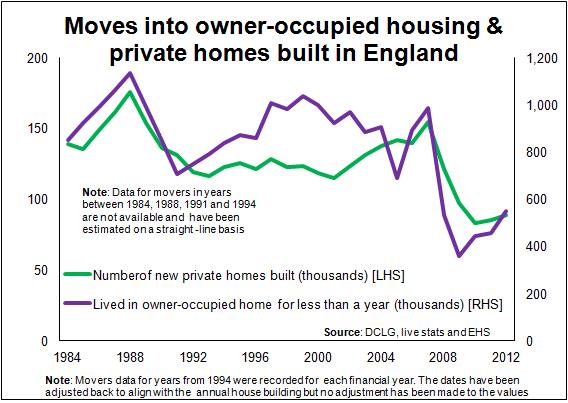 It shows how the number of moves into and between owner-occupied housing is closely linked to how many private homes are built. The link between new home sales and those within the wider market, mainly second-hand homes, appears intimate.
This link strongly suggests that if the number of people in owner-occupied homes falls, or the number of moves made into or between owner occupation falls, then we should expect (all other things equal) a fall in private sector house building, unless, of course, this link is spurious or coincidental or house builders build in large numbers for other buyers than owner occupiers.
Let’s assume the link is real and it is important.
If it is, in my view, it becomes really important.
The data show that the numbers of young people buying into the housing market is decreasing pretty rapidly. This we have known for many years. I covered this in the previous blog in some depth.
This means fewer transactions each year from this group. In turn, assuming our connection holds between overall sales and sales of new homes, house builders will struggle to sell as many homes to this group.
I think we all get that. The effect of fewer first-time buyers has been a problem facing house builders for some while. Fortunately the gap this left in their market proved less painful for developers as a surge in demand from investors and buy-to-let landlords neatly replaced the lost demand from first-time buyers through most of the early 2000s.
Let’s put to one side second-home owners and investors, that’s a whole other discussion. Let’s continue with what might be regarded as the “traditional” owner-occupier market – first-time buyers and existing homeowners.
As we can see from the graph below the lion’s share of newly-installed homeowners owned their previous home. And it’s here with existing homeowners where, in my view, a potentially bigger concern emerges for house builders than the problems caused by shortages of first-time buyers.
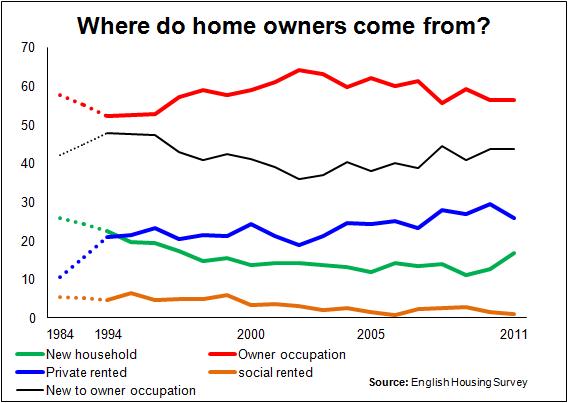 The graph shows the enduring importance of existing owner-occupiers to feed the housing market. The level has been fairly constant over the past three decades, with on average close on 60% of homes bought by previous owners.
The most evident shift discernible from the graph is that rather than new households forming in newly-purchased homes they are forming in rented homes and then, perhaps, moving into homeownership. We have also seen, certainly more in recent years, moves by existing owner occupiers into private rented between home purchases.
In my previous blog I illustrated the decline in homeownership among younger households with a split below and above 45 years old. This age split was deliberate, because this age represents, very crudely, a watershed in the likelihood of a household moving.
Younger households are much more likely to move, even taking into account the differing mix of tenures. So, even with a stable level of homeownership, a shift in the mix from younger to older households will, all other things equal, lead to a reduction in moves into or between owner occupation.
The fourth graph comes from data provided for the Housing Market Intelligence report 2012. It’s from a paper on house movers that I co-wrote with huge input from Dr Birgitta Rabe, a Research Fellow at the Institute for Social and Economic Research, University of Essex.
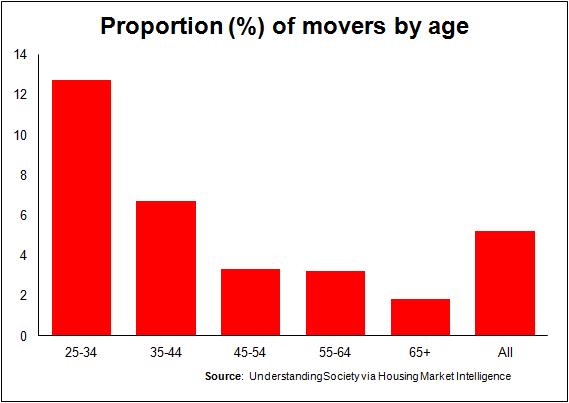 This graph shows just how much age influences the likelihood of people moving home. Certainly younger people rent more and renters move more. But around the age of 45 there seems to be a significant drop in people’s propensity to move. This drop is far larger than can be accounted for by the rise in the level of homeownership.
Interestingly, the Understanding Society data also show that while a sizeable proportion of the 45-54 year old age group may want to move, the proportion that actually do on an annual basis is far lower than for younger age groups.
The findings from the Understanding Society survey is pretty consistent with the findings from the English Housing Survey and its predecessor the Survey of English Housing.
Over the past decade or more the figures have been pretty stable. The English Housing Survey has found the proportion of movers in the band 45+ has been below 5% while those in the 35-44 band have been more than twice as mobile.
This should be no surprise. Many within the 40+ age group will have children of critical ages in their schooling and would tend to seek stability in where they live. They are likely also to be at a more stable period in their employment, than in the earlier years of their career.
Importantly too, the Understanding Society data analysed for the Housing Market Intelligence paper also suggests that outright owners are half as likely to move as those buying with a mortgage. The English Housing Survey suggests that outright owners are even less likely to move, a third as likely to move as those buying with a mortgage.
Now this is pretty obvious in one sense. Older people tend to move less often and outright owners tend to be older.
However, the key point is that what we see within the overall mix of homeowners is the number of younger (pre-45 year old), relatively-mobile, home-owning households plunging. Meanwhile there are growing numbers of less mobile outright owners and fewer more mobile households with a mortgage. The number of homeowners buying with a mortgage has fallen by about 1.3 million over the past 10 years.
Put all this together and we can see a major traditional market for house builders shrinking as fewer moves are made by existing homeowners. Add to this the flagging market for first-time buyers and the prospects look bleak.
To be fair, this is only freakishly scary if we accept that the health of demand in the private house building sector relies very heavily on mobility among existing homeowners and first-time buyers. It might just be a coincidence that a link has existed for the more than 30 years tying the number of private homes built to the number of moves made into or between homeownership.
Personally I wouldn’t bet on that.
Looking at the data and the trends, if we want to find a cure for the plight of low levels of house building, it strikes me that we should be releasing ourselves from a fixation on planning restrictions.
Yes, planning plays a part in frustrating house building. But the above evidence suggests that demographics and the distribution of homeownership seem to be a far more immediate and potentially potent threat to the demand, and hence the delivery, of new private sector homes.
Let’s not forget the private sector provides the vast majority of the new homes built in England.
I believe house builders already sense the shifting sands, maybe not as I have expressed things. They may even disagree with this analysis. But even without research they will know intuitively from their observations of their market that buyers in the “traditional” market are waning. Meanwhile, they will be noting new opportunities.
From what I can see in the data, I suspect we will see the private sector as a whole relying less on the “traditional” market, one populated by owner-occupying first-time buyers, mid-life movers and empty-nesters. This does not mean, however, that private house builders will be starved of a market.
One look at where there’s money will gives some clues as to the opportunities they may seek to pursue.
There is for instance £400 billion of available housing equity in the hands of pensioners keen to move, identified by Demos in a report (pdf) funded by the Home Builders Federation. That suggests one huge market.
Indeed, with so much housing wealth and an ever growing proportion now in the hands of the those above pension age, how this age group behaves may well have a determining influence on how the housing market overall behaves in the future. How much of their wealth will be consumed to keep them in old age? How much will they pass on and to whom? Will they stay or will they go from their existing houses? If so what choices will they make? There are many unknowns here.
Meanwhile we don’t need to look very far to see other growing opportunities. We’ve heard growing noises related to the private rental market for many years. And I suspect we will see many new models emerge as the demographic shifts we are seeing fundamentally change the housing market.
For me the big question is not so much how will private house builders respond to falling homeownership. They will adapt. It is, how will policy and the politician react to these shifting sands?
I have concentrated here on the impact of falling homeownership mainly on private house building. There will be many other elements of the complex housing system that will feel big impacts from a transition from homeownership to rental housing, some positive, some negative and some temporarily disruptive. 10 to 15 years ago the idea of declining homeownership would have been well outside mainstream thinking. So the amount of research into the probably effects is limited. But people are now looking at the implications with increasing interest.