On fears that homeownership is trapped in a doom loop
The decline in homeownership over the past few years is starting to worry a lot more people a lot more for lots of reasons.
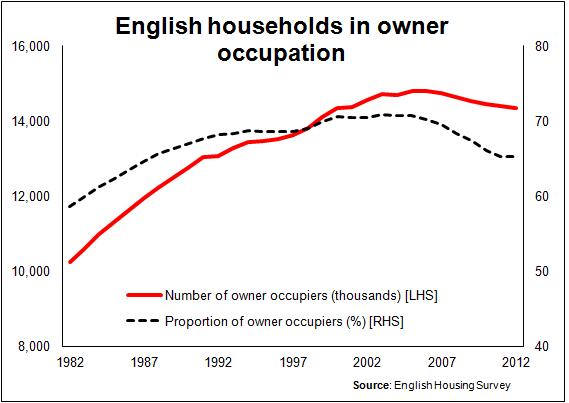
The English Housing Survey shows homeownership among households down to 65% from 71%. The DCLG stock figures show a lower level of ownership, falling from a shade about 70% to below 64% almost two years ago.
 Whatever the precise figures, the subject is filling ever more headlines and pages in think-tank reports. The latest English Housing Survey has sparked a near panic of words on falling owner occupation.
“Is this the end of our property owning democracy? Will Generation Rent give way to Nation Rent?” Asks one recently-produced report by Million Homes, Million Lives 2014.
In truth for those who track the figures the decay of homeownership has been evident for many years. The slide in homeownership in England started in the early years of the new millennium, although the seeds of the decline were planted well before.
Here’s a blog from Jules Birch from a year ago that highlights work in Steve Wilcox’s UK Housing Review. And here (pdf) Andrew Haywood in 2011 looks at the implications of declining homeownership.
The growing problem was, however, hardly noticed in the mainstream at first, but since the recession the pace of decline has accelerated and so have the words written.
The decline is most obvious among younger people, which has played greatly into the intergenerational unfairness argument, around which much of the debate has taken place.
In reality intergenerational fairness is a complex subject akin to weighing the relative values of apples, bananas and fruit cakes to a yeti.
The baby boomers didn’t have the Internet, mobile phones, ipads, soft-play areas and such wide access to university in its youth. But they did get to play in the streets, climb lots of trees, spend endless hours unaccompanied by adults and, for those who did get to university, there were what now look like very generous grants.
On homeownership, though, the data are clear. Younger adults today have been well and truly stuffed. That’s unfair and almost any analysis of the data will show this unfairness is set to deepen.
In reality the implications are much wider. In time, without a swift turn in the tide, this trend will cease to be an intergenerational issue. It will reshape society and the housing sector as a whole.
In the meantime, the continued shift in the intergenerational distribution of owner occupation (and wealth) in favour of the elderly and richest among the young looks set to constrain the demand for homes, restrict house building and eventually influence the type of homes built.
This blog is a precursor to one I plan to write later that will explore the implications for house building.
For now I want to set the scene and examine the data on the distribution of homeowners over time and its implications for homeownership levels.
The top graph shows how homeownership has declined since in recent years in absolute numbers and more so as a proportion of all housing in England.
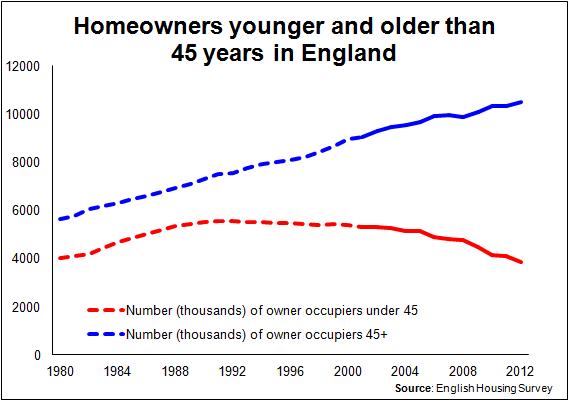 But the aggregate level of homeownership masks some very worrying trends. Let’s look (second graph) at the number of homeowners above and below their 45th birthday. Here we see a growing number of older households and a diminishing number of younger households in owner occupation.
(The importance of splitting the population at 45 years old I hope will be apparent in the blog I intend to write about the effects on house building)
The third graph shows similar data for under 45-year-old homeowners but plotted against all those in the age band 20 to 44.
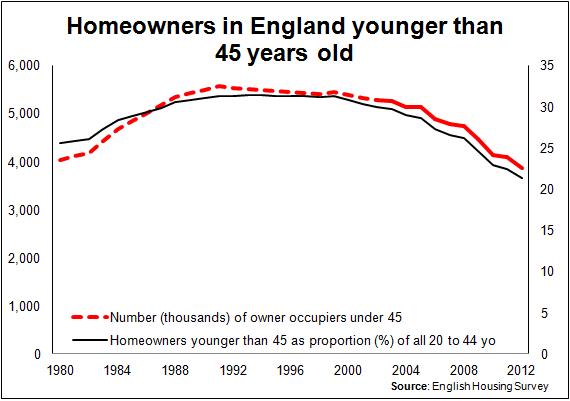 There are relatively few homeowners younger than 20, so this gives a reasonable clue to the penetration of homeownership within this age band over time. As we see, the penetration of homeownership among the under 45s is lower now than in the 1970s. This should particular figures, however, be taken simply as indicative, as the constitution of households today will differ from those in the 1970s.
The data behind this graph shows that from a peak somewhere in the early 1990s (probably 1991), the number of homeowners (household reference persons) under the age of 45 has fallen by about 1.7 million while the number in the age band has risen about 350,000.
The fourth graph shows similar data for the years 1981, 1991, 2001 and 2011 expressed differently to illustrate the proportion of all homes for each age band of household reference person (head of household) in owner occupation.
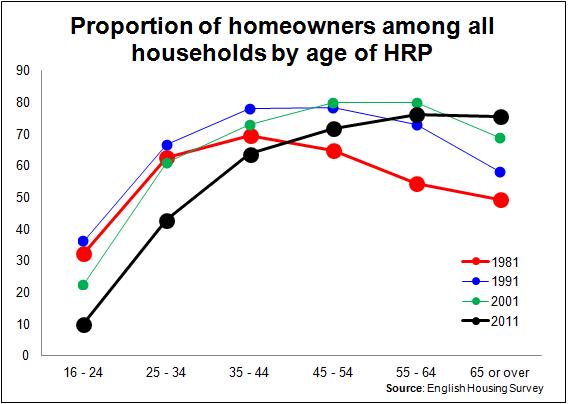 It shows how in the 1980s (the difference between the red and blue lines) there was an expansion in homeownership across all age bands. This expansion was in part a continuation of the across-the-board expansion of home ownership that took off in the 1950s and lasted through the 1960s. Over that period homeownership rose by an average of more than 200,000 a year. The 1980s expansion was of a similar proportion, but the numbers were pumped up by generous discounts offered to sitting tenants to buy their council housing. This inevitably swelled the ranks of older homeowners.
The wave of homeownership expansion, however, was checked in the 1990s (the difference between the blue and green lines), certainly for younger adults. And that downward trend in younger homeowners has accelerated through to today.
The reasons for this trend have been widely discussed and certainly within the academic sphere the 2012 paper Homeownership for Future Generations in the UK, by Geoffrey Meen of Reading University, provides very interesting thoughts on intergenerational inequality and the relative power in the housing market of “insiders” (existing owners) and “outsiders” (newly forming households).
In another earlier paper by Geoffrey Meen, with Mark Andrew also of Reading University, written in 2003 for Real Estate Economics (Housing Transactions and the Changing Decisions of Young Households in Britain: The Microeconomic Evidence) the authors sought to examine the falling level of housing transactions. They pointed to the falling income share of the youngest age groups as a factor.
We can speculate over plenty of other potential contributory factors, such as lower inflation, looser credit, rising income inequality, student debt, extended schooling, young adults increasingly concentrated in cities where renting is more common, increasing youth consumerism, later motherhood.
Indeed there’s a growing library of more populist writing on how the younger generation has been robbed of its hopes of homeownership, presenting a range of explanations.
But in reality the housing market is a complex system. A huge range of factors influence it to varying degrees in various combinations at different times. These factors can sometimes in combination lead to conflicting or paradoxical effects. So I have no intention here to present sweeping answers for the underlying causes of this “demographic time bomb”. My concern in this piece is with the weight of the numbers and the implications of the trends we see.
Whatever the causes, the fourth graph shows – taking 1981 as a datum –homeownership among pensioners continued to rise in the period 2001 to 2011. But for all groups, other than those of pensionable age, it fell and appears set to fall further.
The graph shows that progressively up the age bands we have seen the proportions of homeowners rise and then fall. It is as if a crest of a wave of expanded homeownership is passing through the system, leaving a trough of reduced homeownership in its wake. That crest appears to have reached those of pensionable age.
But, whether we will see over the next decade a fall in homeownership among pensioners is much harder to gauge. The options for older folk are relatively confused. We have no precedent. So any calibration of their collective choices at an aggregate level is far from predictable.
Many factors come into play regarding how people plan for their lifestyle and housing in their later years, such as wealth, pension, the location of close family, health and the provision available from the state.
These will all influence whether pensioners choose to stay put in homeownership (stay in the family home or buy a “more suitable property”), live with a family member or a new partner, rent, or move into sheltered social housing or private owner-occupied retirement housing.
Depending on what choices are available to and made by pensioners we could see a range of outcomes within this group in regards to homeownership over the next decade from a slight increase to a moderate decline.
There is naturally the possibility that it becomes the done thing to cash in your housing chips to secure a comfortable future in some form of rented housing. This might cause a sharp decline in homeownership.
Leaving to one side the uncertainly associated with those in or entering pensionable age, we can expect the pattern of falling homeownership to continue among those of working age. Furthermore, the data suggest (looking at the growing gap between the green and black lines as we track back) that the fall may well accelerate.
For those looking for solace there is much talk of ageing first-time buyers. So perhaps people are just entering homeownership later.
Well here you have to look at the definitions. People like me have been, on one definition, “first-time buyers” more than once. In my case three times.
The average age of “real” first-time buyers in England was the same in 2007 as it was in 1993, according to the housing survey data. And the proportion of first-time buyers 45 years old or more was pretty steady at around 10% in the years 2001 to 2009.
So the idea that homeownership levels will be propped up by older buyers seems unduly optimistic.
For those who believe a high level of homeownership is important in the socio-economic fabric of the nation, the trends are clearly of considerable concern. Not all agree with this view. One can take a view on whether a high level of homeownership is a good or bad thing.
But whatever view one takes it does not alter the fact that, as the house building industry currently functions, the level of homeownership and the transition into or out of homeownership appears to have a powerful influence on how many new private sector homes get built in England.
As I hope to show in a later blog, falling homeownership is not simply about frustrated aspiration, undesirable as that may be. It is, as things stand, a threat to the delivery of new homes. This in turn can but feed into what is looking increasingly like a doom loop for homeownership.