The figures point to more job losses for construction over the year ahead
The latest employment figures show construction losing a further 25,000 jobs in the final quarter of last year, following a slight increase in the workforce in the spring and summer. This leaves construction employment down 20,000 on a year ago.
Taken from the peak in September 2008, the number employed in construction has fallen by 428,000, roughly 17%.
 But perhaps of more note is the mix of that workforce. The number of self-employed workers actually increased in the final quarter meaning that the numbers directly employed fell by 40,000.
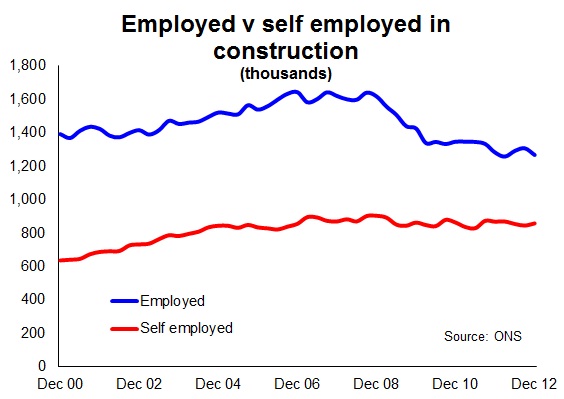
And over the past five to six years we have seen a marked shift towards more self-employed workforce as the top graph shows. The number of self-employed is roughly the same as it was at the end of 2006 while direct employment is down about 400,000.
Put another way the proportion of self-employed workers has risen from about a third to 40% over the past six years.
And certainly in the short term it is likely that the proportion will grow as the uncertainty in the market leads employers to reduce the number of workers on the books and make do with a more flexible self-employed workforce.
It is interesting to note that the redundancy rate in the final quarter of last year jumped to the highest level for two years.
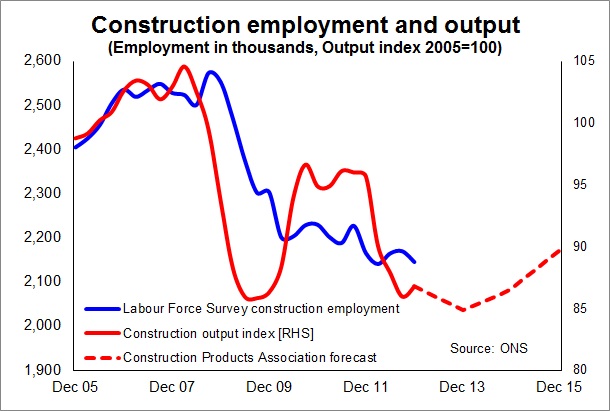
The middle graph shows the level of employment in construction relative to the level of output. I have added one of the least scary forecasts for output growth and from that it seems reasonable to assume more job shedding is on the way.
The final graph is one I used last quarter. It shows a crude measure of labour productivity in construction relative to the average over the ten years up to the credit crunch. Also plotted is the number of jobs gained or lost each quarter relative to the previous year.
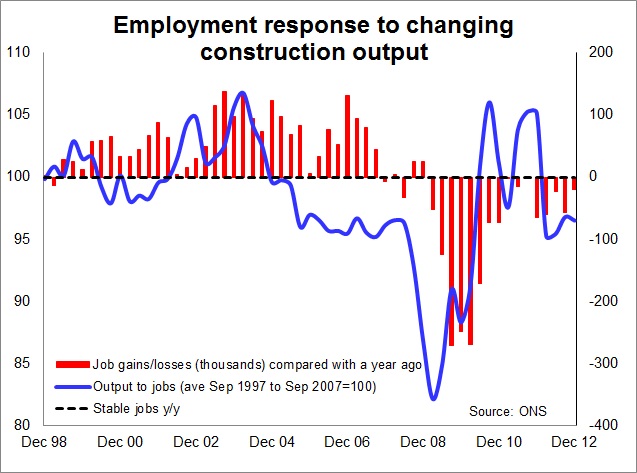 This crudely shows the sensitivity of the jobs market to the changes in construction output. There is a huge number of factors influencing the productivity in construction, not least the mix of work. But the graph does support the view that even as we stand the level of employment is probably higher than one might expect.
(For the record I believe that the low level of productivity in the period 2004 to 2007 is down to a statistical under counting of construction output in that period.)
For me, however, the important thing is that whichever way you look at the figures they do seem to point to more job losses for construction over the year ahead.