Bright prospects ahead for construction. That’s the forecasters’ view
UK construction by 2018 will have witnessed a five-year growth spurt not seen since the 1980s. That’s what is suggested by the majority verdict among the latest batch of industry forecasts.
Taking Construction Products Association forecast numbers, from 2013 to 2018 the industry output will have expanded by a quarter. Only in the post-War era up to the 1960s and in the late 1980s did construction enjoy growth of that magnitude over a five-year period.
This will, if it happens, put huge stress on the depression-depleted resources of an industry already looking to imports of materials and labour to cope with rising demand. Which is, perhaps ironically, one of the risk to the growth forecast.
This resurgence in construction since the start of 2013 has been down largely to fast expanding housing work, especially new build. In the seven quarters 2013 Q1 to 2014 Q3 new housing output rose by 40%. Much of this will be down to the boost from Help to Buy. There has been a longer term upswing since the darkest days of recession, which has seen the new housing output rise 80% since 2009 Q3.
The majority view among the forecasters is that growth in house building will remain strong this year, but ease in 2016. In terms of the value of output this will see all new house-building work rise above its 2007 peak this year.
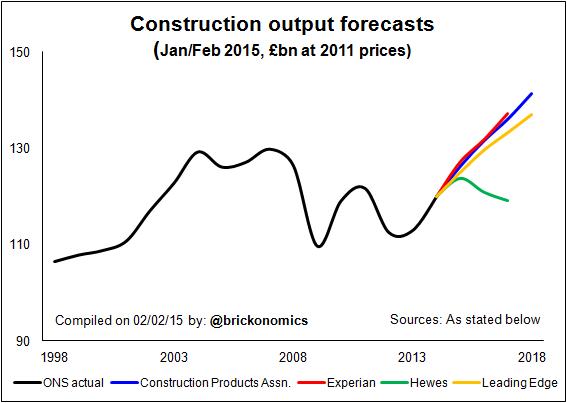 The majority view is that all other sectors will grow over the next two to three years. But there is, among the four forecasts covered here, a dissenter from the full-steam-ahead view of the future. The Hewes forecast, which tends to take on board more of the downside risks, suggests solid growth this year, but a dip into recession in 2016. It expects most new-work sectors to flag.
Hewes takes the view that house building, the big driver of recent growth, will falter in 2016. It expresses concern about a downturn in the cyclical commercial market and does not share the other forecasters’ optimism that the talk of more infrastructure work will convert to a boost to actual construction output.
Its view on direct public sector spending on construction is similarly much bleaker than the other forecasts.
Set against the three other forecasts which appear fairly consistently positive in outlook, the view presented in the Hewes forecast appears very downbeat. But it is worth noting there is considerable divergence in views over each of the construction sectors.
This is perhaps most evident in the infrastructure sector where Experian expects an expansion of more than 40% compared with CPA at 30%, Leading Edge at 15% and a drop of 5% in the Hewes forecast.
Certainly the infrastructure sector is giving forecasters the biggest headache at the moment. There is much talk of work in the pipeline, but the uncertainty over the work is high.
The good news on uncertainty is that the downside risks look less worrying, despite yet another saga of confusion over what will happen in the Eurozone following the Greek elections. But as mentioned earlier, supply constraints may act as a dampener.
Importantly the UK economy does seem to have found a firmer footing since 2012. Then, in the face of flagging growth, the Government appears to have eased on austerity (despite rhetoric to the contrary) and it also pumped money into the system through Funding for Lending. This in turn supported Help to Buy. This boosted mortgage approvals and consequently house building rose to meet the expanded demand.
The overall effect of these policy tweaks seems to have been to turn an extremely dismal economic performance over the previous two years into something more solid.
History and the data suggest it is solid economic growth that pumps life into construction. For my money this does support the view that construction will see growth, unless the economy is hit by a nasty shock.
One other factor that supports economic growth and suggests a bolstered underlying demand for construction is the expansion in the population.
It’s hard to quantify the specific level of demand for construction created by a growing population, but why not let’s try to get a handle on the scale?
Let’s assume each extra person needs the same share of the built environment as those already here. On current figures that comes in at about £80,000.
(The ONS put a replacement value in 2013 on the total stock of UK built environment that is in use at about £5.2 trillion. That’s the gross capital stock figure. The net capital stock, which takes into account that some of it is well worn, came to about £3 trillion. That means there was in 2013 about £47,000 worth of built environment per person, which would cost about £80,000 to replace.)
The population is growing at between 400,000 and 500,000 a year at present, according to ONS estimates.
To meet that increase on our assumptions would take investment of £30 billion to £40 billion. That’s about a quarter to a third of the current investment in the built environment.
Back in the 1990s the population was growing annually by between 130,000 and 210,000. In very round figures this suggests investing between £10 billion and £20 billion a year to provide for population growth.
Boiling it all down the industry needs to be about £20 billion or so bigger than in the 1990s just to accommodate a faster growing population. Add in the backlog of work left as the industry shrank during the recession and there’s a hint at potential demand.
Naturally the relationship between the built environment stock and the population is not linear. On one hand we use buildings more efficiently, reducing the demand. On the other hand we want better buildings and more space so we need to spend proportionately more. In all that there’s the muddle of what buildings and structures we actually need to match the type of society and economy we want and how much we are prepared to invest.
But it’s worth noting the ONS estimate of the replacement value of the built environment has doubled in proportion the population since the 1970s.
The key message from that crude data doodling is there’s potentially very strong underlying demand for more buildings.
Not least among them would be more houses.
The big question, as always, is who will invest and how much to do what?