Forecasts paint a brighter future for building, but infrastructure data clouds the picture
The latest batch of construction industry forecasts out this week paint a brighter picture of growth for building in Britain, but a confused picture for prospects in the infrastructure sector.
I’ll turn to the confusion later, but for now it’s safe to say that, taken as a whole, the forecasts reflect and seem to support the general improvement in confidence within construction.
Despite recurring concerns over persisting fragility within the global economy, Europe in particular, the Construction Products Association (CPA) suggest a strong bounce back over the next five years.
 It expects growth rates ranging from 3.3% and 5.3% for each of the next five years. This should swell construction by 23% in real terms from 2013 to 2018.
As the graph shows, Experian is equally as bullish over the next three years. Hewes provides the usual useful counterpoint, as this forecast tends to factor in more downside risk, so is inevitably much less optimistic.
All three are extremely bullish about housing in the near term and, while Hewes sees growth fading, the CPA takes the view that growth will continue through to 2018.
Experian and CPA also expect strong growth from the commercial sector, with growth of around 15% over the three years 2013 to 2016. Hewes takes a far more pessimistic view.
Overall new work is expected to be a bigger driver of construction growth than repair and maintenance over the next few years. This is consistent with strengthening growth in the economy and growing confidence among investors.
But the forecasters do see respectable increases ahead in repair and maintenance work.
Pulling all this together the forecasters all upped their expectations for building.
There is however one big twist in the tale of these forecasts this time around, the variation in expectations for new infrastructure work. Rather perplexing official data has led to big disparities in the forecasts for the sector.
Experian and Hewes show new infrastructure work falling this year. The CPA penned in growth of almost 9%.
What is extremely interesting and pretty unusual is that CPA appears to have stepped away from using the ONS construction output figures as its datum for new infrastructure work.
The forecasts says: “Recent statistics from the ONS report that Q2 infrastructure output was 8.2% lower than one year ago and new orders were 32.0% lower than a year ago. These declines contradict surveys within the sector that suggest increasing activity. As a result, the infrastructure forecasts are not purely based upon recent output but also take account of survey and pipeline evidence.”
The suggestion here is that the CPA suspects there may be a problem with the Office for National Statistics (ONS) construction output new work infrastructure series. And, indeed, the performance of the series has raised a few questions of late.
But the CPA decision to forecast away from the data currently presented in the ONS infrastructure series raises some intriguing issues.
Unless the figures are revised upward, for the official output figures to hit the CPA forecast for this sector, on my calculations new work infrastructure output in the final four months of this year would have to be 40% up on the final four months of last year.
That would be a phenomenal and, I sense, an unlikely turnaround in work on the ground.
Then again, a problem may be found in the data and the CPA view could end up matching the official figures through revisions to the back series.
But ultimately whether the CPA forecast and the ONS figures end up matching is just part of this puzzle.
What is perhaps of greater concern is whether there is actually a problem with the infrastructure figures or not. This is a moot point. It reveals just how hard it is to forecast change in construction industry activity and just how hard it is to know with certainty the level of work within the various parts of the industry.
Certainly civil engineering contractors have seen strong growth for a year or so. And there has been much rhetoric and bullish talk about investment in infrastructure. This all points to the data being misleading.
On the other hand we must consider what is actually happening within the industry. Inevitably some of the buoyancy civils firms feel is down to the rising tide of new building work and the ground works and services associated. Could it be this that is boosting civils work and disguising weaker infrastructure work?
Certainly, we have a problem in understanding how much infrastructure spending actually goes on construction work – that is how much goes to contractors suitably coded as being in construction and how much to other firms not classified as construction, such as process engineering firms.
A road job has a large construction element, a windfarm far less. The construction content of water projects will vary depending on the proportion spent on mechanical systems and controls.
There are of course other potential sources of confusion within the data classification and within the collection process.
Are we missing some specially-formed joint venture businesses in the sampling, or underplaying their importance?
Are firms not classified as construction undertaking what is construction work and so work is being wrongly allocated to, say, manufacturing?
Are firms correctly allocating construction works within the forms they fill in for the ONS?
There are a host of possible effects that can distort a data time series.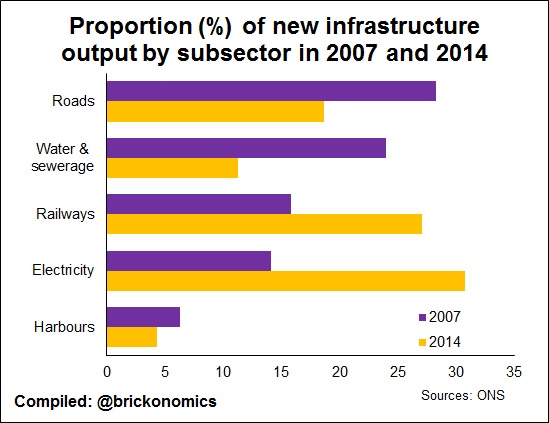 Certainly a variation in the mix of work will have an impact.
So let’s out of curiosity compare the proportion of each subsector within new work infrastructure in the four quarters to Q2 2007 with the four quarters to Q2 2014.
We see there has been a profound shift in the mix of work. Road, water, sewerage and harbour works have declined, while rail and electricity work has increased.
Could it be that a big headline investment in electricity gives the impression of lots of work, but in reality only a low proportion of that work is recorded as construction?
These are questions that need research before we know if a problem with the ONS data is likely or not.
Ultimately without deeper knowledge it is extremely hard to know for sure if the ONS infrastructure time series is a reasonable or unreasonable reflection of the path of construction’s share of the investment in infrastructure.
It is certainly a conundrum and once again illustrates the extreme difficult in measuring each month how big the construction industry really is.
Note: the bottom graph has been replaced since first posting as it originally had 2017 not 2007 in the title.