What really drives planning applications?
They say: “If you don’t ask, you don’t get.”
That’s certainly true for house builders and developers looking to gain planning permission.
If they want to increase their supply of permissioned land on which to build houses they have to put in a residential planning application in the first place, which then may or may not be rejected.
So with house building now back on the agenda in a big way we decided to use Barbour ABI data to examine how changing market conditions influence the number of residential planning applications made by house builders.
What we found was a bit puzzling.

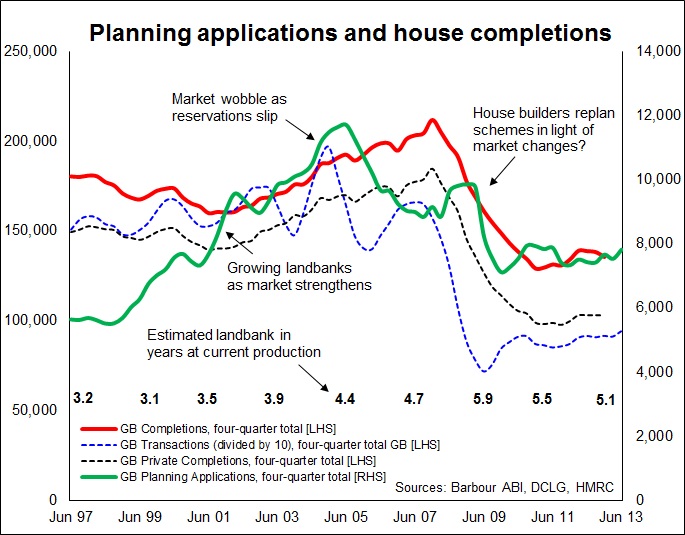
The green line in the graph shows residential planning applications over the previous four quarters. There’s a sharp fall in planning applications in 2005. But why?
Surely this was the time when the industry and Government were in heavy discussions about how to boost housing supply? This was the time when the debate was informed by the Barker Review which saw land supply as a key constraint to increasing housing supply. Why would house builders seemingly take their feet off the accelerator at this point?
We decided to track other data against the planning applications numbers to see if we could get some clues. These included housing completions, both private (dotted thin black line) and the total (the red line), and housing transactions (dotted thin blue line).
We also made some estimates of the consented landbanks held by the house builders based on company reports. The figure we use broadly equate to the middle of every second year from 1997. These are listed within the graph.
And we naturally explored other data, such as the Home Builders Federation survey of net reservations, for possible steers on what happened.
The first thing we noted was that in the years leading up to 2005 the level of planning applications grew rapidly, far faster than completions, which were pretty flat across the period.
House builders appear to have been increasing their collective landbank as the market improved and house prices were on a strong upward trend. From being able to accommodate about three years’ worth of current production the combined landbank increased to be able to supply more than four years.
Research using Barbour ABI data in the 2007 Housing Market Intelligence report suggested then that UK house builders were expanding their collective consented land supply by somewhere between 30,000 and 60,000 plots a year in the early 2000s up to about 2006, as the swelling numbers of applications produced increased numbers of approvals.
There are, however, three features of these planning applications that should be considered, even though the net effect may well be neutral with the first point cancelled out by the second and third.
Firstly, over this period the average number of home within an application increased, particularly as firms geared up to build more flats. So each planning application potentially netted more homes.
Secondly, there were increasing numbers of rejections, which means that fewer of the applications led to approvals.
Thirdly, many of these applications were for re-planning applications as house builders looked to increase the density of development as was the way in the early noughties. So the numbers of existing applications displaced by new applications may well have risen sharply.
Despite all these undercurrents, it seems clear from the estimates made that the collective landbank had grown considerably by 2005 and set to expand further given the level of permission sought.
This seems fitting, given the pressure to expand production and the complaints over constraints on available land. So why did the house builders seemingly ease off in their quest for more land? Why did they submit fewer planning applications?
Looking at the transactions data and reading company annual reports of the day does provide clues. Late 2004 and early 2005 were challenging times for house builders.
In mid to late 2004 there was a severe wobble in the market. As we can see housing transactions fell sharply. From the start to the end of 2004 mortgage rates on new business on average rose from 4.42% to 5.35%. This hit sales. Not surprising then that the transactions line falls rapidly from late 2004, as fear increased of ever rising interest rates.
This fed through into the new-build market. Figures coming back to the HBF survey for net reservations show a disturbing fall.
With their landbanks strong and with rising land prices, it seems natural that house builders would consider just how far they were prepared to go in expanding their land supply. Furthermore their attention was, over this period, increasingly on consolidation in the market with a spate of high-profile takeovers.
However, despite complaints over lack of available land and heady targets for house building, there was little or no recovery in the level of planning applications in 2006 and 2007. Then the credit crunch hit. After that it is pretty clear why house builders would have held back on submitting applications.
The blip we see in 2008 may well be down to house builders re-planning sites as first-time buyers and investors deserted the market and the value of flatted schemes plunged.
The above of course is just one interpretation of the data. But if it’s close to fair, it rather suggests a subtly different picture of the land supply issue than is often painted.
Is housing supply really constrained by a lack of available land coming through? Or does the supply of land respond to the demand for houses?
The answers to these questions naturally have major implications for housing policy. And in reality the answers are probably not straightforward.
But it’s always worth challenging received wisdom. Therein lies enlightenment, hopefully, and opportunity probably.
This blog was originally written as an article for the Barbour ABI Construction Review