Why today’s GDP estimate for construction growth is so worrying
The estimate for construction growth within the latest GDP figures was truly surprising.
We already had two of the three months of data in for the fourth quarter and from that you could build a reasonable case for growth between 2% and (perhaps) 5%.
Those unfamiliar with the data might see that as a sign of recovery. It would not have been for many reasons, one – the lag inherent in the monthly survey returns – I will discuss later.
So the official estimate is that construction enjoyed quarterly growth of 0.3%. That leaves activity in the fourth quarter of 2012 11% below a year ago. This was very much unexpected.
 Since publishing the October and November figures, the statisticians at the Office for National Statistics will have produced from limited data a December figure to help with the fourth quarter estimate.
In large part this will be based on matched pairs of early returns. This compares the latest monthly performance of firms providing early returns with earlier data. The ONS has found pretty robust and that it improves the estimate.
If all other things remained equal this suggests they found a near 20% drop in output from November to December. Big falls happen but that is a very big fall.
It is however very possible, perhaps likely, that this will be revised up. But it may be that late returns for October and November led to a downward revision there. I don’t know.
We have to be a bit careful with these figures because even small changes in the data shift it in ways that can have profound impacts on rates of change and the bases from which we make comparisons.
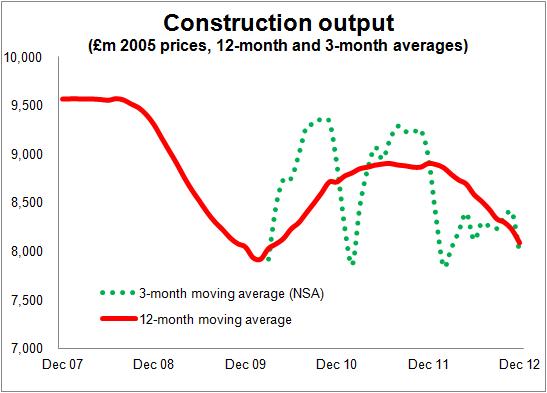
But I’ve done some crude calculations and the graph shows the effect on construction output if we accept the GDP estimate for the fourth quarter and hold all historic figures the same. I said they were crude…
For all that the graph shows how construction is still, on a 12-monthly basis (red line), diving into a deep recession. What it also shows (green dotted line) is that we seemed to have missed the summer bounce in work this year.
Now my gut feeling is that there may be upward revisions to this data. But even so as is pretty clear from the graph (I hope) that will not alter the basic trend in construction.
Things are looking bleak. This latest data just added a black border to the calling card of a deep recession.
But to return to why these data are perhaps a bit more worrying and why even if there had been a bigger bounce it would not have signalled a recovery we have to look at how the data are collected.
There are lags within the data. There are plenty of firms providing output data that lags at least a month if not more behind when the work was actually done.
This means that the impact of the Jubilee and the Olympics will almost certainly have spilled over into later months. So, some of the Jubilee effect will have been felt in the third quarter figures.
Also much of the upswing that will have followed as firms caught up will also have been recorded in November and December rather than August and September. This will mean the shape of the recorded output will differ from what really happened.
The net effect in this case would be to reduce the third quarter. Assuming this is the case we quite reasonably expected to see the fourth quarter improve rather more than it did, boosted in some part by the post Olympics effect.
This rise in output could have occurred despite the underlying trend being downward.
So, what is worrying about the estimate for fourth quarter activity is that it is hardly an improvement on what was an extraordinarily poor third quarter.