Average house prices may be stable, but the figures hide trouble
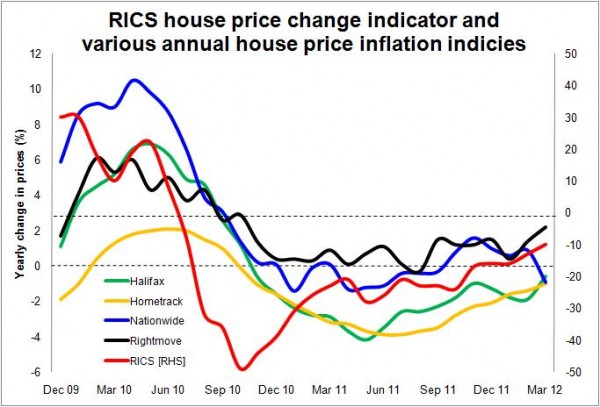
Much fuss is made over the monthly ups and downs of housing price indicators. But in reality those released recently suggest the average UK house price remains more or less locked at the steady altitude it has followed for more than a year.
Taking a consensus from the plethora of available measures suggests an average home costs you today within 1% (probably 1% less) of what it would have cost a year ago and more or less the same as it would have cost two years ago.
The first graph shows a selection of measure of annual inflation in the UK housing market. It shows that house price are on average pretty stable prices in cash terms.
 In real terms, however, homes are getting cheaper as inflation eats into the nominal price.
The Government will see this as good news.
It fits the pattern housing minister Grant Shapps says he wants to see over the coming years. He wants house prices to be stable while earnings rise. He doesn’t want house prices to plunge.
And luckily for him, short of hitting an economic iceberg, there seems to be little on the horizon that will disrupt this current holding pattern of stable nominal prices and real-term house price falls.
Even the normally bullish housing experts at the CEBR economic consultancy have been shaving their forecasts for house price growth in recent times. They now see house prices rising less than inflation over the next two years.
Meanwhile City traders in future house prices see the average house price in cash terms down a bit in the coming year but back to the current nominal price in two years time, according to the latest Future HPI produced by Peter Sceats & Associates.
At first sight stability in nominal house prices seems a reasonable aspiration and a desirable outcome. No nasty crash, negative equity contained and a gradual improvement in the balance of earnings to house prices.
That is all very encouraging. But it ignores some very disturbing downsides that get far less publicity than trivial ups and downs in average house prices.
Before getting to the disturbing downsides, it’s worth examining a couple of points relating to the indexes and their limitations.
Firstly, special factors impact on the data. So, among the various market interventions, the ending of the stamp duty holiday for first-time buyers will probably have had a short-term upward impact on the indexes. Meanwhile, milder weather so far this year probably also supported prices.
Taking the various factors together, it’s probably fair to assume the indexes are reading a bit higher than they might otherwise.
Secondly, interpreting “average house prices” can be problematic. Averages are useful statistical devices to get a feel for a central tendency and to boil down to a simple number what’s going on. But averages, particularly the commonly used arithmetic mean, can disguise detail and lead to misleading interpretation.
A mean value for house prices, however smartly weighted and adjusted, can and does disguise important changes within the spread of house prices. So, if expensive homes get more expensive while cheaper homes get cheaper, the average might suggest no change despite an important shift within the market.
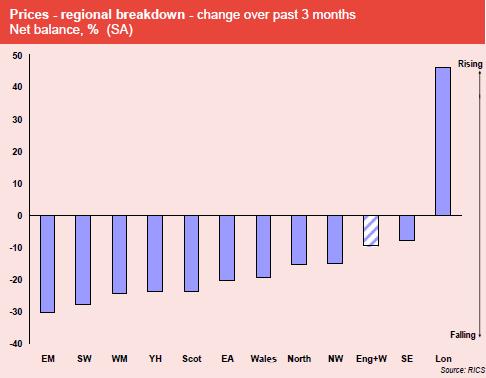
Indeed, this appears to be what’s going. Closer examination of the data shows prices rising in the more affluent and expensive south, while prices are falling in the cheaper more cash-strapped north. Even within local markets we see a divergence of fortune, with expensive enclaves outperforming many cheaper locations.
This is not a surprise. The second graph taken from the latest housing market survey by the surveyors’ body RICS illustrates this point vividly.
 The graph doesn’t however show another divergence in the mix, the difference between buyers today and buyers in the past. The average buyer today is likely to have either much higher income, or much more housing equity, or both than the average buyer before the economy went pear shaped.
This effect shows up in data provided by the Council of Mortgage Lenders. In early 2006 when house prices were about what they are today (on the Nationwide measure at least) less than a quarter of mortgages went on homes worth more than £250,000. Today more than one in three mortgages are used to buy homes worth more than £250,000.
These are important differences within the market that get lost when we just look at averages.
It’s not worth getting too hung up on this point. The important thing is to recognise that house price indexes are basically derived from data on homes actually bought and sold and that mix of homes and, indeed, the mix of buyers can change quite markedly over time.
That means it can be risky to draw too complete a comparison between today’s average house price and the average house price before, say, 2007.
For all that, the “average house price” has meaning, even if it isn’t what you thought it was. It’s a rough guide to what’s going on in the market.
And from the latest data it’s fair to say that prices are not plunging despite the fragile economy and a widely held view that houses are overpriced.
The Economist magazine, for instance, currently rates Britain’s house prices as overvalued by 22%. This is despite a fall of 10% since 2007 and the value being eroded by general inflation.
If the Economist is right, and house prices are overvalued, this is intriguing given the weakness of the economy.
And for me, as I will explain, the continued high price of housing remains a severe drag holding back house building and is a major hurdle to a more balanced housing market.
High house prices and the limits on funds available to borrowers have profoundly changed the mix of buyers in the market. As was said earlier, buying houses has become skewed more towards richer people (either the bigger earners or the wealthier) than it was before the crash.
In simple terms the current market is excluding from homeownership more young people and more lower and middle-income people. The pool of potential buyers has shrunk. This implies fewer sales. This in turn suggests, as we shall see, fewer new homes built.
A huge amount of the blame has been heaped on the lenders for being parsimonious. But if we compare today with 1997 when a recovery from the previous housing crash was becoming established the figures paint and interesting picture.
Bank of England data suggests outstanding lending secured against dwellings in real terms (adjusting for RPI) is about double the level it was 15 years ago. And, despite shrinking by more than half in the wake of the credit crunch, the amount approved to individuals for house purchases remains about a third greater now in real terms than it was 15 years ago.
So relatively speaking lenders are lending more new money today and have much more money in the game than 15 years ago when the market was beginning to heat up.
The problem is that houses cost much more in real terms than they did in 1997. Depending on which index you choose and what rate of general inflation you pick, homes now cost between 50% and 100% more after inflation is taken into account.
Irrespective of what judgement lenders take on risk, significantly higher real house prices mean fewer mortgage approvals for a given amount of mortgage funding. It’s simple. Money doesn’t go as far if you buy expensive things.
Naturally with limited cash to go around lenders will favour the less-risky better off. This further reduces the number of loan approvals, because richer people can afford bigger mortgages and more expensive homes.
And then there is the buy-to-let market, which seems to be taking off again and is taking almost 10% of the mortgage pie.
So it should come as no surprise that the number of loans for house purchase recorded by the Council of Mortgage Lenders stood at 511,000 in 2011, compared with 1,103,600 in 1997.
Looking to the future, it’s hard to see how funding will improve markedly, which suggests that the number of buyers will remain constrained.
The question then is whether this low level of effective demand (buyers with cash to buy) will press down on prices. The simple answer is yes.
But we have then to take into account the response of sellers. What seems to be happening is that as prices soften many sellers leave the market or steadfastly refuse to accept a price below their aspiration.
With interest rates at historic low levels fewer sellers are under pressure to sell than might otherwise be the case. Many choose to stay put rather than trade up, down or sideways and some choose to let out their existing property rather than sell it.
This mechanism of supply rapidly responding to match the demand does seem to be what lies behind the stability house prices.
Naturally the pattern is not even. Where demand is strong prices creep up, while in locations of poor demand prices fall. But the ability and willingness for many sellers to hold off from selling is keeping house prices elevated.
Now, the consensus among economists is likely to be that relative stability in house prices is a good thing for the economy as a whole. A house price collapse could have all manner of nasty outcomes.
But stability comes at a price. There are disturbing downsides.
There is of course the increasingly publicised moral and political issue. Put simply, is it right that access to homeownership should become ever more restricted to the older and better off? This question I will leave hanging. It is outside the normal remit of brickonomics.
Smack bang in brickonomics territory, however, is the disturbing effect that the current market mix is having on constraining house building at historic low levels.
We can expect mortgage approvals to remain at low levels for some time yet, for the reasons described above. This, however, in turn implies that housing transactions will remain low and that sadly points to low levels of house building.
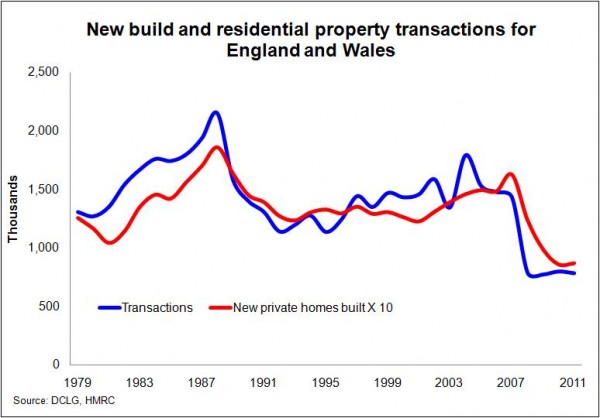
 The third graph shows the long-term relationship between private new-build and transactions for England and Wales. For the past 30 or so years roughly one in 10 homes sold has been a private new-build home.
The exact reason for this is not well researched. But, interestingly, I ran some data kindly provided by Hometrack and found a similar pattern at regional level, although the ratios of new to second-hand homes sold appear to differ region to region.
Of some concern is that the regional data suggest fewer new-build homes are sold as a proportion of all sales in London and the South East, just where house building is increasingly focussed.
It may be that the current crop of housing strategy policies will break the relationship between housing transactions and new home sales. But to me that looks like a long shot.
If not we are left with a nasty problem. Relying on a market-led solution to house building will not (nor should it be expected to) drive a major boost in the number of new homes built. There is a market failure.
So once again, it is time for Mr Shapps to think more clearly and more ambitiously and find a real solution to boosting house building numbers.
My best offer is the one I have banged on about for ages which is to exploit the Bank of England’s Asset Purchase Facility to fund house building.
2 thoughts on “Average house prices may be stable, but the figures hide trouble”
Great post on the subject – I have often ranted on average house prices too. Thing is, brushing them aside as purely an indicator would be fine if the market were as liquid as a stock exchange. The fact is however it isn’t.
The differences at regional levels are extensive as you point out and don’t illustrate a useful point as far as a homeowner is concerned.
I read your blog – ‘Average house prices may be stable but the figures hide trouble’ – with great interest, but do feel that we are still underplaying the severity of the problems facing us.
Look at some of the issues:
The housing market is where it is and this is after three years of very low mortgage interest rates. What happens when they return to 5, 6 or 7%?
People need a minimum of a 5% deposit to buy a house. For a first time buyer wanting to get a £150k property they need £7.5k in CASH, plus several thousand more to pay for lawyers, removals, etc. How long does it take to save this sort of money? That’s if you can!
With house prices stable, how are people to cover their interest-only mortgages? Some 150,000 owners a year need to find cash to pay off their capital and most do not have it. What happens to them?
How many people have endowment policies which will not pay off their mortgage?
How many people are looking to downsize but cannot because either there is no buyer or if they did sell they would not free up enough share cash on which to live.
The latest Bank of England figures on housing equity withdrawal showed that, in 2011, home owners paid off £36bn, and this followed a similar figure in 2010, £33bn. Where has all this money gone, especially when you consider that net lending by banks is running at around £10bn a year?
As you rightly stressed in your article, house prices vary by region and, in my humble opinion, have been totally usurped by London and the South east. In the last quarter of 2011, 1,537 homes were sold at prices of over £1m, down slightly on the Q4 2010 number of 1,689. Five years ago, this number was half this level.
And how many of these properties were bought by overseas buyers looking to move their cash out of Greece, Spain, Italy, etc. One article I read suggested that 40% of properties over £1m related to such deals. What happens when this stops?
Currently, some 35-40% of all house purchases are from cash buyers. How much of this came from overseas?
We use to have a housing cycle where the first time buyer got a 95% mortgage (I am ignoring the mad days of 125% loans), he/she moved up the ladder at least once before downsizing to a smaller place and spending his/her surplus cash on holidays or the kids.
That’s all gone.
We need to be looking at a new life cycle for housing and how this will impact on house builders, families themselves, the DIY and refurbishment sector, as well as government taxes.
And all of this assumes no major external problems such as Greece or Spain leaving the EU, North Korea throwing a wobbly or Iran closing the Straits of Hormuz.
In my opinion, the housing market will not return to pre-2007 levels in this decade; we need desperately to build truly affordable homes, say four-times average wage, as a maximum; we need to find a way of handling all those people who will not be able to pay off their mortgage; and, finally we must to stop kidding ourselves that we need to build 250,000 new homes a year. We may need them, but we cannot afford them – at least in the next decade.
Phew, I am glad I got all that off my chest!
Comments are closed.