Something’s wrong with the official private housing repair and maintenance data
I and others have long held doubts about accuracy of the private housing repair and maintenance series within the construction output data.
And if there is a fault with the data series it is important that it be addressed if policy makers, analysts and academics are not to draw wrong inferences from it.
Part of the problem is that there was a change to the construction series in 2010. This has definitely presented many problems. Certainly the timing of this change to the series has made it much harder to understand how the industry has responded to the recession.
But there is, and has been for some while, a case for arguing that the problem with the private housing repair and maintenance series may lie more with the earlier data than the later data and may not have its roots simply in the change to the survey in 2010.
The official statistics for the volume of construction work undertaken in the private housing repair and maintenance sector show a more or less continuous fall since a peak in late 2002, as can be seen from the first graph.
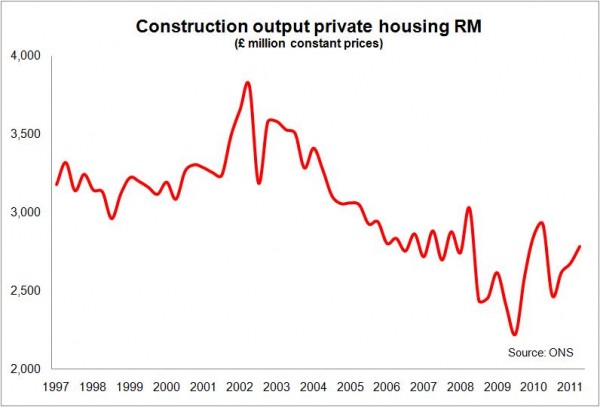 This jars with most people’s experience and with other observations of industry performance, particularly evidence from builders’ merchants.
There are various possible reasons why this data may be at fault. It is an extremely tricky sector to monitor.
Here are some of the stronger possible explanations for why the data might not be reflecting what is actually happening on the ground.
Noble Francis, the economics director at the Construction Products Association, has raised doubts about the deflators used to convert the cash value of work recorded into a volume output. These are doubts I share.
And a further issue, very much related, has been put to me by James Hastings, the head of construction research at data business Experian. He is concerned that the deflators may not have adjusted well to potential increases in specification.
Meanwhile, I have pointed to the coincidence of the surge in workers from the EU ascension countries with the point at which the data starts to become “unbelievable”.
This is a rather complicated argument that goes something like this.
The former construction survey used to include an estimated figure for what it described as unrecorded output. The current survey does not. Unrecorded output would be that undertaken by firms too small to sample. To get an estimate the Government’s business department BIS used Labour Force Survey data.
Clearly if migrant workers were underrepresented in the LFS survey, being harder to pick up because a lot of newcomers live in houses of multiple occupancy (HMOs), this would probably lead to an underestimation in the amount of unrecorded output.
This problem, were it to exist, would be most evident in private housing repair and maintenance, where a higher proportion of work is undertaken by one-man-band operations.
This issue has been in part explored by the Office for National Statistics and I’ll not be following that argument here.
I will focus on the issues of deflators and specification.
I decided to look at the private housing repair and maintenance figures from the other end of the telescope, the consumer rather than the construction firm.
The reasoning was that while the data may not be measuring exactly the same things, it would potentially throw up discontinuities and oddities.
And so it does.
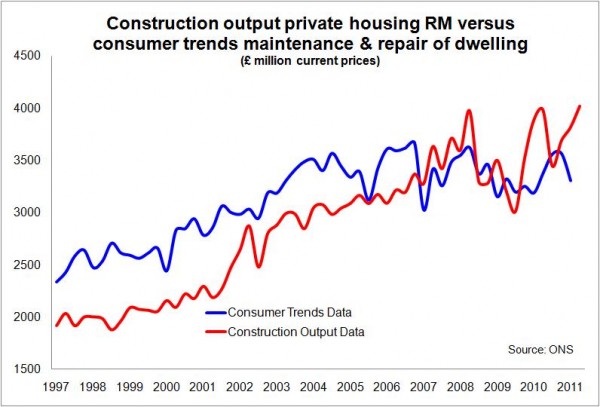 What is noteworthy is just how similar the data is when recorded on a current price (cash) basis. From 1997 to 2003 the data follows a similar path, albeit that the consumer trends data is running at about 25% or so higher.
The relationship does, however, appear to become more disconnected after 2003.
But on the basis of the pre-2003 data it seems reasonable to assume that there is a broad similarity between the sets of figures.
Things become very interesting when we look at the respective constant price data – that is the data adjusted using deflators to take account of inflation within the sector.
The third graph shows how, on the consumer trends figures, private housing repair and maintenance work held up through to mid 2007, or put another way until the credit-crunch. This is in stark contrast to the construction output series.
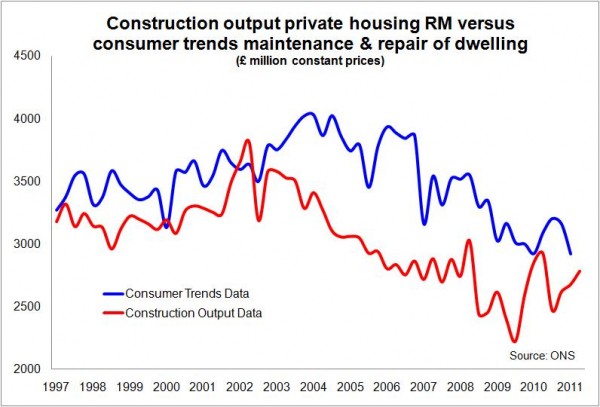 What we see is that between 2002 and the recession the consumer trends data suggests much more work was done in the sector than the construction output figures would suggest.
A rough calculation suggests that if we adjusted for this divergence the output in constant prices in 2006 and in 2007 would have been about £2 billion higher each year.
This (conveniently for me) fits with my view that the peak of construction output was higher than the figures have suggested and the drop during the recession deeper.
I have put together a further graph looking at what happens to the current price data for private housing repair and maintenance from the construction output series if we apply the different deflators.
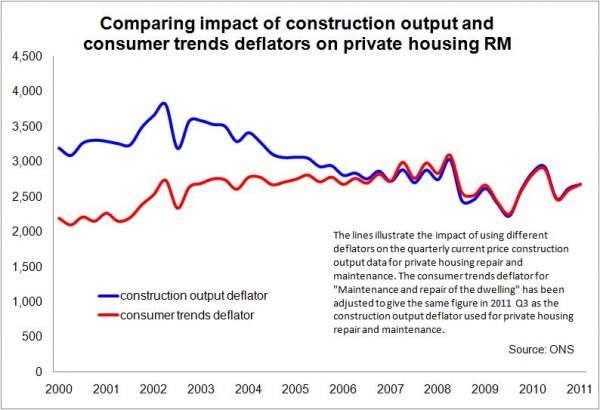 Interestingly the recent data matches well. But there does seem to be a “transition” from 2002 to 2007.
Now, here it might be worth looking at the notion suggested by James Hastings that there might have been a shift in the average specification during this period, which might lie behind the rather strong deflators applied to the construction output data over that period.
One simple explanation might be that we moved from “Changing Rooms” to “Grand Designs” and everyone upspecked their work.
But leaving assumptions based on TV habits to one side, if we look to the data we see that there is a strong argument to suggest that there may have been an increase in the specification of private housing repair and maintenance work.
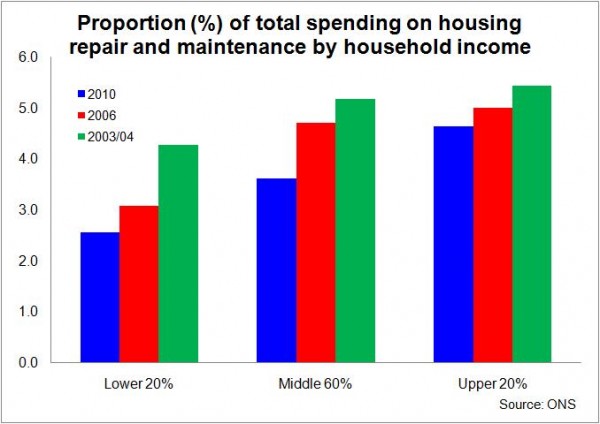
The Family Spending data show (see graph below) that over the past few years the poorer families have reduced their spending on housing repair and maintenance relative to the richer families.
So we are seeing a greater proportion of the private housing repair and maintenance undertaken for the richest families. While we cannot know from these figures that this means that there has been a rise in the average specification of the work, it seems a reasonable assumption.
 Either way what we have is sufficient evidence to support the views of both Noble Francis and James Hastings and certainly plenty of cause for further investigation.
It may seem to some that the accuracy of the historic data is purely of academic interest. That would be a wrong assumption.
Policy makers will draw conclusions from this data and if it is inaccurate or misleading then the chances are that the policy decisions will be the wrong ones.
Not that good data necessarily leads to good policy making. But it helps.