The Financial Times, Barbour ABI and construction prospects
Did you see the FT piece with the Barbour ABI figures? What do you think? A bit worrying don’t you think?
That set of questions in various guises came at me a few times yesterday as I was sipping a cappuccino in a sunlit Covent Garden cafe and while lunching on tapas with an old friend in Soho.
My rare treat of an away day from numbers was not to be.
Still. My initial reaction was: the figures may look scary, but probably are not really that scary.
Back in my garret, that’s what I think now.
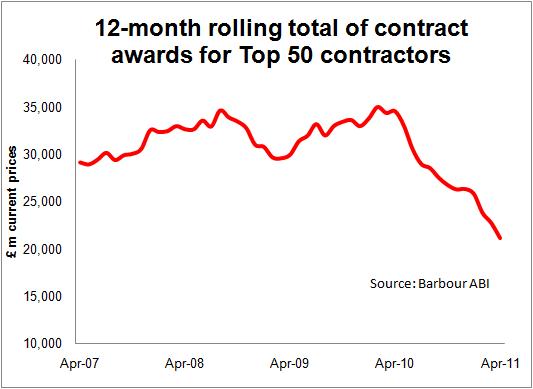
Yes, the figures showing a 39% drop in the work won by the “Top 50” contractors since the new government came in are clearly consistent with a decline in construction. And most of the industry number-crunchers expect construction output to fall and the underlying trend in the official output figures sort of suggests a decline is already underway.
But the idea that the Barbour ABI figures can be used as proof that construction output is set for a rapid decline or that the orders books of construction contractors have collapsed should be at least moderated.
 What the Barbour ABI figures show is the headline value of contracts awarded in a given period to a selected 50 contractors. Naturally that list of contractors changes over time as some go bust or shrink and some get larger. And the figures don’t include a large slice of house building work.
What is more construction contracts are a mixed bag of varying types, varying duration, vastly varying values and spread about unevenly around Britain.
Furthermore the value of work stated in the contract is unlikely to be the amount of work done in the end on that particular job.
For all these and a bunch of other reasons we have to be careful when we try to interpret the meaning.
Barbour ABI provided me with the figures for contract awards. Here is what they look like on an annualised rolling 12-month basis (see above). And without consideration it all looks pretty depressing.
But hang on a minute hasn’t construction been through a nasty recession? Where does that show up in the orders awarded?
Between the credit-crunch and the new government being installed, the value of orders in cash terms on a 12-month rolling total basis rose by about 15%.
It would seem from these figures that the major contractors have been filling up their order books despite a recession that meant less actual work was being done across the industry as a whole.
When considering new orders what is more important, the amount that has just gone in or the actual level of order books? Both tell you something, but the level or the order books provides a better clue to how much work is in the pipeline.
Here are some points worth noting:
1. We would have expected a lull in orders following a change of government, as the new incumbents assessed the capital programme, whether the intention is to cut workloads or increase them.
2. We would have expected authorities to have boosted contract letting in the latter stages of an administration and for contractors to have pushed to get deals signed ahead of a change of government.
3. We would have expected the lull to impact more on larger ticket contracts, thus the fall in the work to the Top 50 would be exaggerated in comparison with the impact across the industry as a whole, on the grounds that the larger contractors do the larger jobs.
4.We would have expected some private sector clients to be a bit wary of signing new contracts until they had assessed the intentions of the new government.
5. In the latter days of the previous administration there was a noticeably higher proportion of large value contracts let, which would have disproportionately gone to the larger contractors (this can be seen in the supplementary tables of the ONS new orders figures). This I have written about before.
6. In general larger contracts last over a longer time, sometimes many years. So the impact of new contracts won on the pipeline of work will vary.
7. The proportion of all construction work won by the Top 50 will vary over time. So it is not a direct measure of the orders won by the industry as a whole.
8. Facing a recession larger firms may start to move down the food chain, looking to pick up smaller jobs than they normally would.
9. The bigger contractors will, especially in a recession, pick up work that will not be measured by the contract awards tallying done by Barbour ABI, such as through acquiring firms or picking up work from companies that have gone bust.
10. The data is measured in current prices, not volume of work. If prices are falling, for a given cash value there is more work. If prices are increasing, the cash value represents less work.
11. There are plenty of other factors to take into account.
Here’s a set of figures that might help. I took 10 minutes to check the latest company accounts for Morgan Sindall, Kier and Balfour Beatty to look at the level of their order books. This is what I found.
Balfour’s order book for UK construction services stood at £3.7 billion at the end of the year compared with £3.9 billion a year earlier. It is focussing on overseas expansion and professional services which are expanding.
Morgan Sindall’s order books showed up as £3.6 billion compared with £3.2 billion. And Kier’s order book across construction and support services showed, according to my calculations, £4.1 billion against £4.5 billion.
On balance these firms were about as well placed at the end of 2010 as they were at the end of 2009.
The Barbour ABI figures are interesting and do show a very disturbing trend, if this is not checked. But they do not of themselves point to a collapse in the construction sector. Well not yet anyway.
2 thoughts on “The Financial Times, Barbour ABI and construction prospects”
I think the first point that there has been a hiatus in new work since the change of Government is the most important driver and unfortunately there is still very little visibility of what the pipeline of public sector work is going to be (with the odd excpetion of projects like Crossrail). However, to the questions “hang on a minute hasn’t construction been through a nasty recession? Where does that show up in the orders awarded” I would say yes housebuilding has gone through the worst recession in living memory excluding 1st and 2nd world war years, but the recession in Commercial & Public Building and Infrastructure is only just beginning. Different cycles…
Mark, I agree there is a real risk that things might get much worse in the non-resi sectors you mention. The leverage effect of public funding above its direct effect may well have been underestimated. And the Barbour ABI data are not inconsistent with that. My concern was that we were not reading into the figures things that they can’t really tell us. Also, at a personal level, it was refreshing to have an opportunity to be on the less gloomy side for a change…
Comments are closed.