A 53,000 jump in construction workforce, but the jobs data make a mockery of output stats
The good news is that construction found room for 53,000 more people among its workforce in the second quarter of this year as workload bounced back.
The bad news is that if construction jumped in volume terms (not seasonally adjusted) by 13.3%, as the official data suggest, 53,000 is not a very impressive improvement in the employment figures at all – representing a rise of just 2.5%.
So what does this all mean?
Well this is yet further evidence that the construction output figures may in the fullness of time just prove to be bollocks – I use the word not for shock value, but because that is the one that seems to be most used to describe the second quarter figures when I find myself discussing them with others.
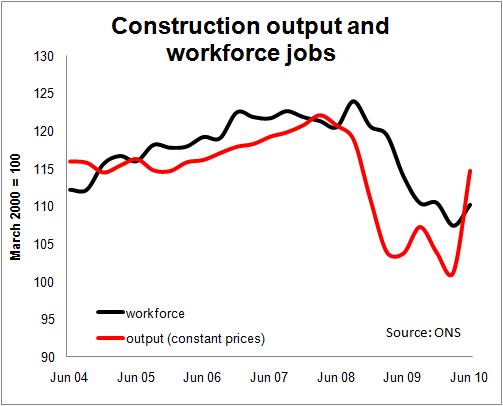 Here’s the graph. It shows constant price output on a quarter-by-quarter basis indexed to March 2000 along with workforce jobs presented on the same basis.
What is clear is that jobs and output do not follow slavishly along the same line. We wouldn’t expect them to, as different types of construction employ different levels of labour. Also there will be lags in the employment cycle and there will be productivity gains and losses as practices and regulations change over time.
Fine. But having traced the two series back to the second quarter of 1978 I have not found one quarter-on-quarter movement that vaguely matches in scale the latest jump in the relationship between output and employment – which you might call a crude measure of labour productivity.
The figures suggest an increase in productivity (on this crude measure) of 10.5%. The nearest you can find to this figure over the past third of a century is 7% back in the summer of ’79 at a time when output on a quarter-by-quarter basis was bobbling about a lot and the workforce was pretty stable. The workforce is far more flexible today.
What does this tell us?
Well for most people I talk to who engage with the construction output figures on a regular basis, this is all very worrying.
There was undoubtably a reasonable rise in output in the second quarter. But the trade survey data, chats with any number of people and the statements made by firms themselves all suggest at best a pretty good second quarter that felt a bit sluggish in June.
But something appears not right with the scale of the rise in workload suggested by the output data and someone needs to get to the bottom of what is wrong or prove that nothing is wrong.
The alternative to rechecking the data and its various manipulations is that we accept without question that in volume terms 13.3% more work was done in Q2 2010 than was done in Q1 2010.
And if that truly was the case, the industry should chastise itself for not swinging and singing from the rafters?