Official figures show construction output falling again, but devils lurk in the detail
Construction output slumped back into decline in the final quarter of 2009, after a supposed rise out of recession in summer.
That is the headline story from today’s release of the construction output figures.
But dig a bit deeper and we see some unsettling implications in the numbers.
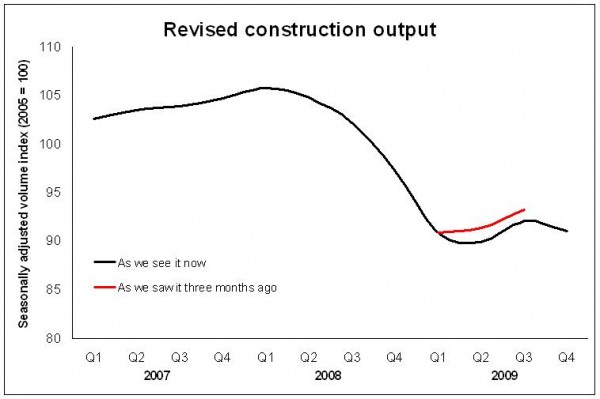 Firstly the statisticians now believe the hole of the recession was deeper in 2009 than they previously thought (see graph 1) and instead of growing in the second quarter of last year the industry is now thought to have shrunk.
Frankly there is a wide belief among industry economists that the third quarter figures, which still suggest growth, are suspect.
The huge leap in the level of repair and maintenance work recorded in the official figures has lifted more than a few eyebrows among the number watchers within the industry.
Are we to believe that quarter-on-quarter public sector non-housing repair, maintenance and improvement really increased by 26%?
If you find that hard to swallow you might have to sign up to the view that construction probably didn’t jump out of recession in the third quarter of last year.
Not that I blame the statisticians. I suspect the problem is down to the Poles who can’t make there mind up whether they want to work here or at home. Excellent workers, I grant you, but they arn’ arf messing up the stats, as I have suggested before.
But leaving the vagaries of the statistics to one side, there is a more disturbing trend lurking in the data with a rather nasty barb.
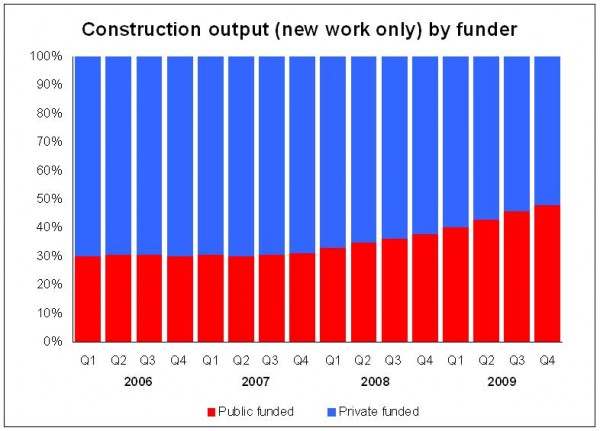 If you do a crude breakdown of the work sponsored by the public sector, doing your best to include PFI, and the work that is properly private sector, then you find that the public sector underpins close to half the work currently under construction. That compares with less than a third before the credit crunch (see graph 2).
For me that graph in one picture illustrates the increased level of risk in the construction market given the likely pattern of future public spending.
Another unsettling trend emerges when we look at the amount of cash coming into the industry as opposed to the amount of work it has been doing.
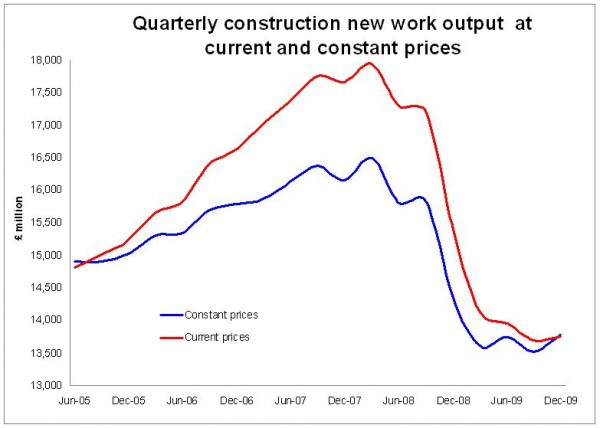 Graph 3 shows the pattern of current price work (that is what cash is paid) against constant price work (the statisticians’ best estimate of the volume of work done). The graph only takes into account new work, partly because I think something is amiss with the repair and maintenance sector data.
What is clear is that the picture is much bleaker when we look at the money the industry is dragging in. If we were to rebase the cash against of general inflation the trend would look very much worse.
But amid all this gloom it was refreshing to sense the revived confidence at the recent Ecobuild show. Wandering around you didn’t have to be an old media wallah to pick up the gentle breeze of optimism blowing through the airless halls of Earls Court.
Was that a double-decker stand I spotted? I haven’t seen one of those for a while.
I sincerely hope the new found confidence is well placed, but my instincts suggest there may be a touch of irrational exuberance coursing through the veins of the industry resulting from the fiscal adrenalin and monetary morphine administered when UK plc was in intensive care.