Construction figures pose a real headache for GDP estimates
The latest official figures for construction output suggest a leap of 8.6% in construction work in February following the recorded fall of 6.8% in January.
What does this tell us?
No doubt it is pleasing to see work on the up, but I fear there is a potential danger of misinterpretation of what is happening on the ground if we take these figures at face value, even taking them on the basis of a rolling three month average to smooth lumps and bumps.
After the horrid December weather we would have expected a bump up in the January figure. But it was absent. We do see a bump in February output figures.
For me, the latest data seem to add weight to – if not sound support for – suspicions that I and other observers share that there is a lag in the output figures. That is to say the January figure is more representative of what actually happened in December and so on.
Behind these suspicions is the way firms fill in the survey forms for each month. I and others suspect they use different accounting sources, possibly bank statements, possibly invoices, possibly accurate estimates of real work done.
Most of these will be records taken well after the actual work is done, with varying lags between the work and the record of the work.
This probably means we have a spread of lags in the various bits of data dependent on the type of work and the type firm and the type of accounting method used by each firm. What is more we may have inconsistencies caused by seasonal delays in handling administration and, indeed, changing payment times.
That suggests we should be very cautious about accepting that the published figure for activity in February is a fair reflection of the actual activity.
It must be said the ONS is aware of this and currently is undertaking research to get a better picture of how firms actual fill in their survey returns. Indeed it is only really since the survey started last year to record monthly data that we have been able to see this suspected lag.
For us in construction we can look at the pattern of output and it would seem fair to suggest on the balance of current data that there may be about a month lag between what’s happening on the ground and what appears in the official data. That is to say for a better picture of what happened in December you might chose to read January’s figure.
This is fine for us in construction. What will be interesting to see is how this is played out within the GDP figures.
The snow effect in December was thought to be large and hit construction particularly hard.
Now if we find that the data related to this effect is in fact lagged and the result is that recorded GDP in the final quarter of 2010 is larger than it should be as a result and GDP in the first quarter of 2011 is smaller, then our policy makers will be viewing a distorted picture of economic activity.

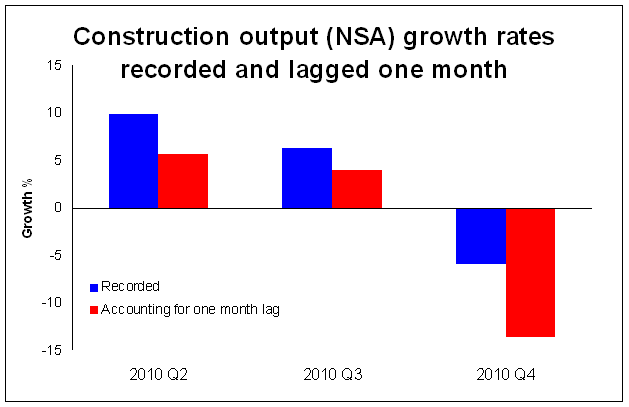
I have produced a very crude graph, see above, to illustrate just how profound the effect can be of shifting the data by just one month on the growth figures for each quarter. I have used the non-seasonally adjusted current price data.
Given the timing of the snow, we are not talking about small differences here. It is quite possible that the “real” – for want of a better word – drop in output in the final quarter of last year could have been at least twice that recorded, if we pull the data series back a month.
To maintain a flat level of output in the first quarter of this year compared to the final quarter of last year – not taking account of seasonal adjustments – we will need to see an extraordinary jump in the output figure for March.
Pull the data back a month and the likelihood of seeing growth in the first quarter is high.
To put this issue into context and depending on the manipulations made to adjust for inflation and seasonal effects, it is reasonable to assume that a one month lag in the construction figures could easily reduce GDP output growth in the final quarter of last year by 0.2% more than was recorded – that would be 0.7% as opposed to 0.5%.
This implies a very different shape to the recovery.
What is more, if this lag is real, the GDP growth figure for the first quarter of this year would be significantly subdued and suggest a worsening state of economic activity than is actually the case.