Correction: Plant hire and construction output
My thanks go to Marco Yu who quite correctly pointed out to me that I had made a mistake in a graph tracking construction output and the index of services data for hire of equipment, which I re-used on March 30 in a blog on having put it together for an earlier blog on February 25.
I say thanks despite the need to eat a large dollop of humble pie and apologise for inadvertently misleading those who take an interest in these things. And in that group I can safely include myself.
Though I can take some comfort in the knowledge pounded into me throughout my education that the pursuit of truth – whatever truth might be – is more important than ones pride and desire to be proven right.
Anyway, for those who are interested in knowing how this problem arose or how easy it is to make a cock up if you ignore the bleeding obvious, here’s what happened.
Firstly I had to convert the monthly index of services data into a quarterly figure to match with the frequency of the construction output data. I used for simplicity a straight average (mean). I then sought to rebase the figures to 2000 Q1 = 100. It was here that I stupidly pulled in the wrong line of data for construction output.
I had expected a strong relationship, but I recall that I was quite unsettled to see such a close correlation, mainly because I had held suspicions (well documented in this blog) that the existing construction series underplayed the size of the construction boom. Sadly, I remember thinking at the time, this remarkable correlation blew a big hole in that pet theory.
Also, worryingly, I would have thought I knew enough about plant hire to know that different sectors of construction hire different amounts of plant – not taking into account the varying use of contractors’ plant – so, while you I should have expected a fairly close relationship over time I should also have expected some erratic separation in the two series here and there.
Furthermore, I knew the series also includes an element of hire that is not construction related.
What, looking back, I cannot fathom is how I failed to spot this obvious mistake having already roughed the graph (with the correct data series) using the base indicies. What’s more, I had done the less obvious bit and called the ONS to make sure that the two series were derived from unrelated surveys.
Anyway – crass error – but below is a new graph with the proper figures (I certainly hope) this time. It shows a close relationship, as you’d expect, but some points of departure.
Interestingly the lines do suggest a closer relationship in recent time and also do seem to support that pet theory that the existing construction series may have underplayed the size of the boom, the use of plant surging in the period from mid 2005 to the peak in early 2008.
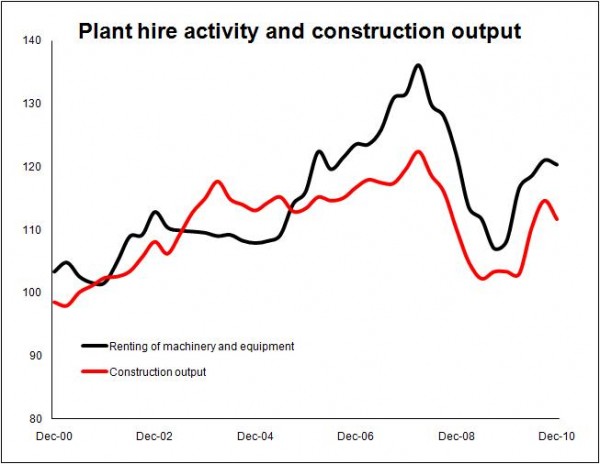
For reference, the two data series are from:
FVYM: Renting of equipment without operator and of personal and household goods, chained volume index, seasonally adjusted, 2006=100.
The latest published figures for the index for all construction work as presented in table 1. These are constant 2005 prices, seasonally adjusted.
One thought on “Correction: Plant hire and construction output”
plant hire rates remain a challenge in the construction sector
Comments are closed.