Instead of drop-kicking the planners, shouldn’t we really half-nelson the rich?
The blame game over who’s responsible for England’s housing crisis and silver-bullet “here’s-the-answer” approaches to solving it is growing into a national sport.
Various interest groups, professions, political parties, social classes, business groups and their mouthpieces come under fire. Meanwhile, each fires back their silver bullet, with a crowd of suitably-armed commentators joining in.
With this kind of entertainment the lobby to encourage ITV to re-run World of Sport wrestling must be flagging.
With that sad image in mind, I thought I’d introduce a variant on the who’s-to-blame-for-the-housing-crisis spectacle, as a kind of surreal equivalent of tag-team wrestling. Tag teams always added extra fun and extra confusion.
This might not take off. But as a first attempt to mix up the debate I want to explore why we might want to half-nelson the rich rather than drop-kick the planners.
The question of who’s most to blame between between faceless planners with their endless red tape and nimby well-to-do homeowners is one that bubbles. But some data I’m currently exploring for a forthcoming project and a recent Shelter blog prompted me to present a few charts.
My thought was that in a wrestling match, these charts might just turn the crowd’s sympathy away from Big Daddy and Giant Haystacks (fighting the rich-homeowners’ corner) and provide a little more support for the wrestling fans’ love-to-hate tag team of Mick McManus and Steve Logan (in the faceless-planners’ corner).
To ensure a clean fight (as if) I’ve used some Barbour ABI planning data I had already structured. From this I derived a planning-rigidity measure to compare how easy it is to get planning permission by local authorities. The details are below along with the various data sources.
Before being bombarded with useful suggestions, I know it’s a crude measure. It doesn’t take into account how adaptions to behaviour or cognitive bias might lead those putting in planning applications to “tone down” plans that they might expect to be rejected or take a punt on the off chance when opportunity arises. It doesn’t take into account variation in the approach at different planning departments to pre-application discussion and a bucket of other effects. It doesn’t correct for other variables.
But I really think we’ll lose entertainment value if we dwell too much on the more delicate aspects of analysis. This is housing-data tag-team wrestling and it’s all about show, quick thrills and fighting dirty.
If you want detailed rigorous academic work on this, I can recommend Dr Christian Hilber and his colleagues at the London School of Economics. It’s extremely good value for the more sophisticated.
So, seconds out: Round One.
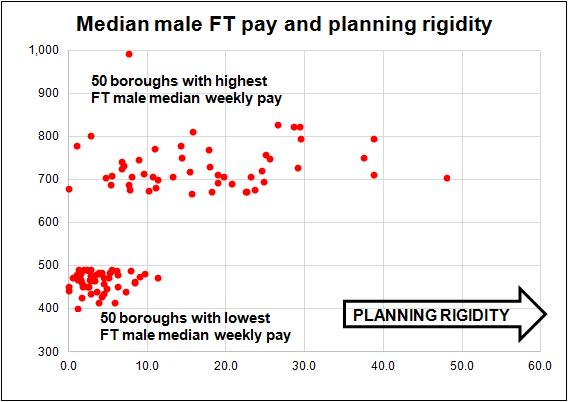
McManus, booed, grapples Big Daddy with data showing how the 50 local authorities with the highest median rate of weekly pay for blokes in full-time employment are clearly displaying more planning rigidity than those with the lowest pay.
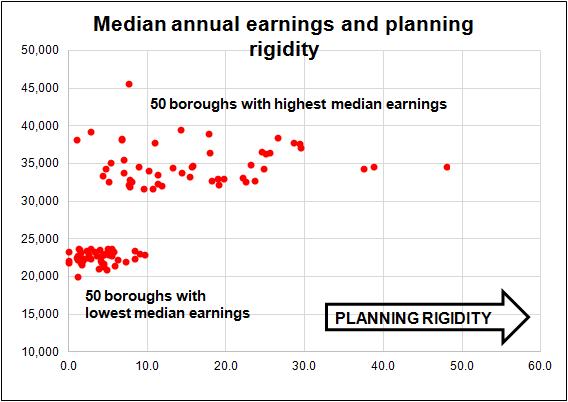
Big Daddy retorts with a reckless body check to test McManus on median earnings. McManus dodges, Big Daddy falls on his face to ooohs from his fans. The 50 boroughs where median earnings are highest are clearly more likely to reject applications. He shouldn’t have gone there.
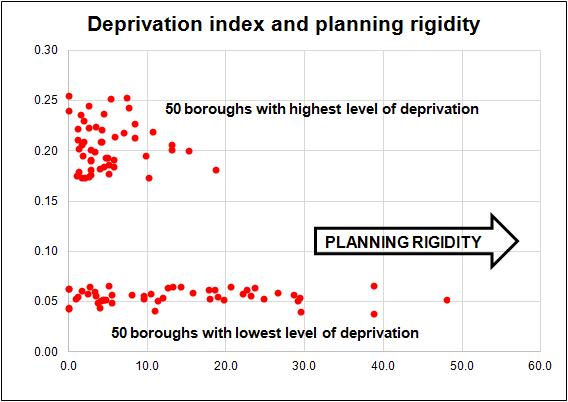
Meanwhile Logan, to jeers, leaps the ropes and fixes Big Daddy in an arm lock with powerful data on deprivation. The most deprived areas clearly are more planning friendly. The crowd didn’t like that. But, respect. It was a powerful move.
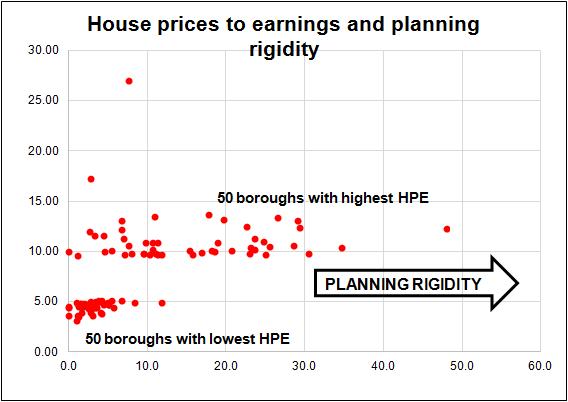
Giant Haystacks doesn’t like this one bit. He climbs through the ropes, but is floored as McManus, with a Diving crossbody, illustrates that where house prices to earning are greatest there’s clearly significantly more rigidity in the planning system.
Ding
At the end of round one you can sense a mood-shift in the crowd. They really don’t like that after-the-bell backchat from Giant Haystacks to the referee on the Kensington and Chelsea outlier. There’s clearly no love for the super rich here, even among the well-to-do fans supporting Haystacks. He claims the data show that you can pack a borough with rich people and have a pretty flexible planning response. But this raises more suspicion than support.
Seconds out: Round Two
McManus and Logan are obviously looking to exploit tenure differences in this round.
Logan’s Elbow smash on Big Daddy, with the force of data on renting and planning rigidity, certainly added much to the planners’ cause.
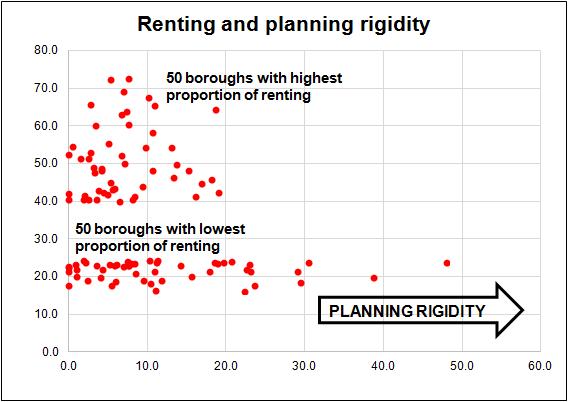
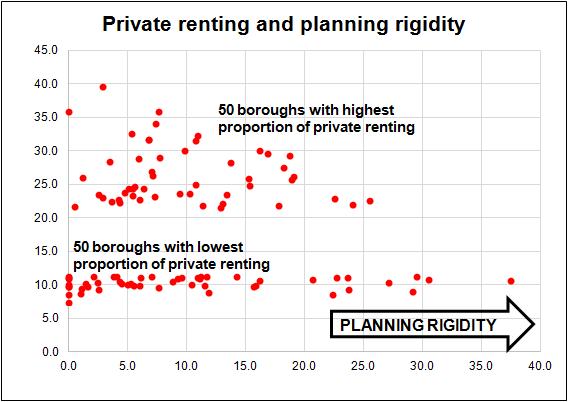

This strong data suggests that, far from it being awkward faceless planners at fault, tenure plays a huge part. He’s clearly looking to gain advantage here with the implicit suggestion that renters (by and large poorer people) tend to be more relaxed about new homes being built near them.
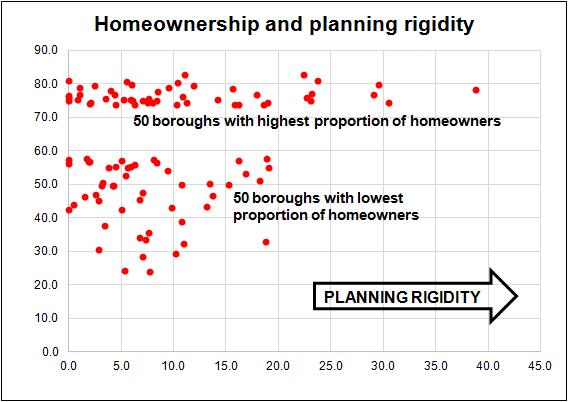
Logan follows up with a battering ram showing how homeownership is clearly linked with planning rigidity. The implicit link that homeownership is more strongly associated with the well to do hurts the rich-homeowners’ team.
Ding, the bell rings allowing Haystacks and Big Daddy to regroup after a pummelling.
Seconds out: Final Round
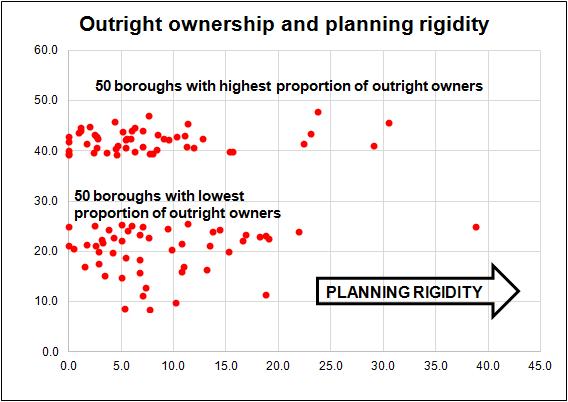
Leading for the rich-homeowners’ team Haystacks pulls what looks like a blinder with a drop kick that clearly lets McManus know that the relationship between planning rigidity and how many people own their home outright is extremely inconclusive. As he performs this tricky manoeuvre for a big man, he’s heard to scream “Don’t blame the grannies.” That wins a huge cheer from a large section of the crowd.
No one was really expecting that. The untested assumption was: old folk; probably UKIP; anti everything and bound to be a thorn in the developers’ side.

Logan’s furious. He dives into the fray trapping Haystacks with a Crossface chicken that demonstrates the relationship between the prevalence of households with a mortgage in a borough and the level of planning rejections.
Powerful stuff and it caught the crowd a bit by surprise until they considered the implications of leverage. They get it. There’s a hum as fans discuss the merits of the argument that people with mortgages have more to lose from falling prices and more to gain from rising prices.
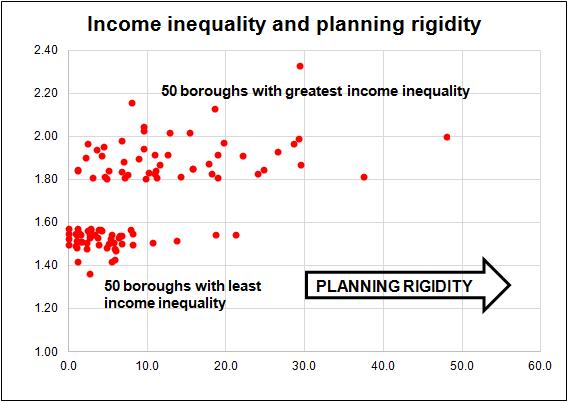
With the fight clearly going their way, the faceless planners’ penultimate move, an Aided wheelbarrow facebuster, brings screams of “what about income inequality” from the crowd. They’re really up for it. Even the higher-earning homeowners with a significant vested interest in rising house prices. And would you believe it? McManus and Logan have got Dig Daddy and Giant Haystacks each in a Half nelson.
Ding, Ding
Saved by the bell. It’s over. A bruising battle. No submissions. But the planners clearly take it.
Their display in support of blaming rich folk rather than faceless planners for planning rigidity resonated with this crowd, who really are not appreciating the protestations from Big Daddy’s and Giant Haystacks’s corner demanding multivariate regressions.
Ah, but there’s some afters. McManus, in an unexpected move, strides up to the promoter Magnus Oligarch. “When I say rich people are more to blame than planners, I’m not just fingering you. It’s more like an upper-quartile thing.”
That may have blown it with this well-heeled crowd.
However much he goes on in the post-fight interviews about planning outcomes being a reflection of a political debate within the community and just one element of a complex of issues, I think he may once again be cast by the fans as the villain.
The planning-rigidity measure is derived from the number of planning applications made to each local authority for five homes or more refused or withdrawn divided by the number approved. The data covers all applications made over the decade 2000 to 2009 inclusive. It’s been multiplied by 100.
Data sources are a bit muddled for obvious reason of practicality. They are:
- Planning data (for England only): Barbour ABI
- Median Full-time male weekly pay: ASHE, via nomis (Crown Copyright Reserved)
- Median earnings: ASHE, via nomis (Crown Copyright Reserved)
- Income inequality, 70th percentile divided by 30th percentile male full-time worker 2013: ASHE, via nomis (Crown Copyright Reserved)
- Tenure: Census 2011, via nomis (Crown Copyright Reserved)
- Deprivation Index 2009: DCLG English indices of deprivation
- Median house price to median earnings 2012: DCLG live tables Table 577