The changing shape of the UK construction workforce
The latest employment figures for construction don’t tell us a huge amount about job prospects in the industry other than things seem to be getting worse. But we knew that.
Overall employment in the second quarter of this year was 1.1% down on a year ago and is about 15% down on the same quarter five years ago, just before the credit crunch.
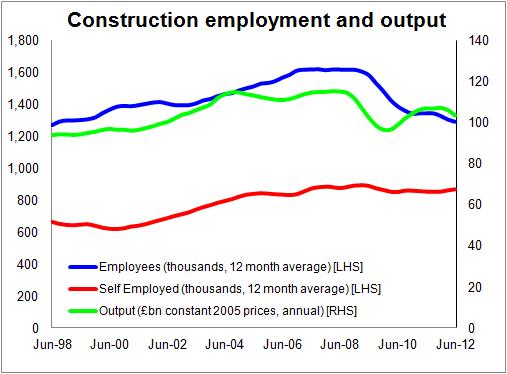
 Overall the data suggest that over that period output has also dropped about 15%, although there has been a bit of a rollercoaster ride to get there.
But when we look at things graphically we do see one big change. The number of directly employed has fallen sharply while the number of self employed has remained pretty steady.
Taking an annual average (to smooth out some of the lumps and bumps) the drop in directly employed from the second quarter of 2007 to the second quarter of this year is 20%, while the fall in the number of self employed is less than 1%.
The net result is a rapid shift towards more self employment. In 2000 the proportion of self employed has dropped to nearly 30%. At the last count by the Office for National Statistics for the second quarter of this year that proportion stood at a shade above 40%.
One thought on “The changing shape of the UK construction workforce”
Also worth checking this post out as well – On Why Rise Self-Employment is Bad for the Economy:
http://flipchartfairytales.wordpress.com/2012/08/23/why-the-rise-in-self-employment-is-a-bad-thing/
Comments are closed.