A tale of two indicators – what to make of the latest construction PMI and orders figures
When construction indicators point in different directions what are we to make of it?
The February Markit/CIPS purchasing managers’ index released today is very bullish, suggesting the best growth for 14 months and the best month for new business for 21 months.
Meanwhile, the official ONS construction new orders figures for the final quarter of last year were very downbeat. They showed a gloomier picture, with orders down on the previous quarter by 2.5%, down 15.4% on a year earlier.
And comparing 2011 with 2010 we have to accept the rather sobering figure that orders were 14.1% down.
So what does it all mean? Are things getting better or are they about to get worse?
The first thing to say, the stock point, is that looking at one month or one quarter in isolation is a fool’s game. Things need to be seen in context.
The second point to make is that the PMI and the orders figures cover slightly different times and measure different things.
That out of the way what can we say that might add some meaning?
Let’s deal with the PMI index which rose from 51.4 to 54.3 against a benchmark of 50 for no growth. That’s not a super-strong growth reading, but it’s suggestive of significant growth in the industry in February.
For me, the index runs rather high historically and I tend to mentally rebase the figure, so perhaps anything above 52 rather than 50 might be a positive reading for the index in my mind at the moment.
Another point to make about the index is that it does not really tell us that much about level, rather about direction of travel and the expected direction of travel. So it is less of an indicator of where we are relative to where we were. It is more an indicator of where we are going and likely to be heading in the future.
Taking all that into account, there is an interesting point to note. The firms on the survey panel are still on balance looking to shed labour. That’s a pretty strong indicator of their view of the growth rate and prospects.
What’s more all sectors recorded – commercial, civils and housing – were up in February, so we might be seeing some coordination effects that might be creating a blip in the month.
So, my advice is not to get too excited about this one month’s PMI data.
Likewise I would suggest not getting too gloomy about the new orders figures, although there is plenty to get gloomy about. The drop of 15.4% on the same period a year ago is a base effect issue. Orders blipped in the final quarter of 2010 after the mid year hiatus created by the change of administration.
What interests me is the level of orders now compared with the boom. Orders are coming in at about 40% below the peak level.
Now the heterogeneity of orders – in both type and timing – means that they pass through the system and turn into output at greatly varying rates. So a 40% drop in orders does not necessarily mean a 40% drop in output will follow in orderly fashion. Certainly tracking the historic data for orders and output of new work only suggests that the drop in orders during a recession tends to be far more potent than the drop in output.
There are other effects which create disparities between the orders and output figures, but now is not the time to discuss those, but it is worth noting the fact that they exist.
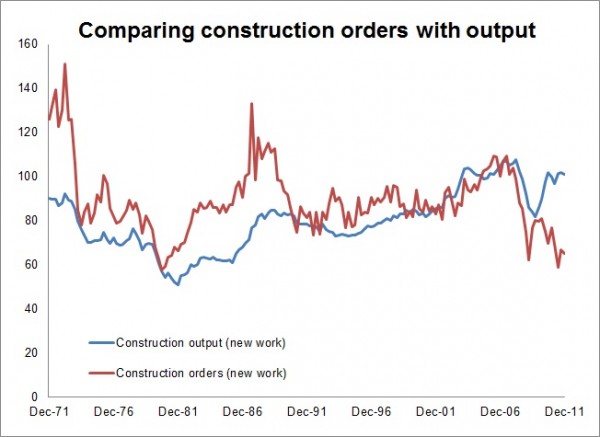 Certainly what we see from the historic time series graph (note: these should be treated with some caution) is that recessions appear to create far greater collapses in orders than in output in the near term, which is to be expected.
All that said the two series are not so disconnected that a drop of the magnitude we have experienced in the orders figures would not profoundly dent output.
Of particular note when we examine the data more closely is the rapid rise in the proportion of large contracts as the industry entered the recession. In the period 2003 to 2007 the top 50 contracts accounted for about 20%, between 2008 and 2010 the proportion rose to about nearer 30%.
This in part explains why big contractors were slower to squeal about the recession. But it also suggests that the fillip they received in their forward order books from that splurge of big contracts will fade, leaving a hole in the pipeline of work down the line.
To help get a better idea of what happening I have posted some graphs below.
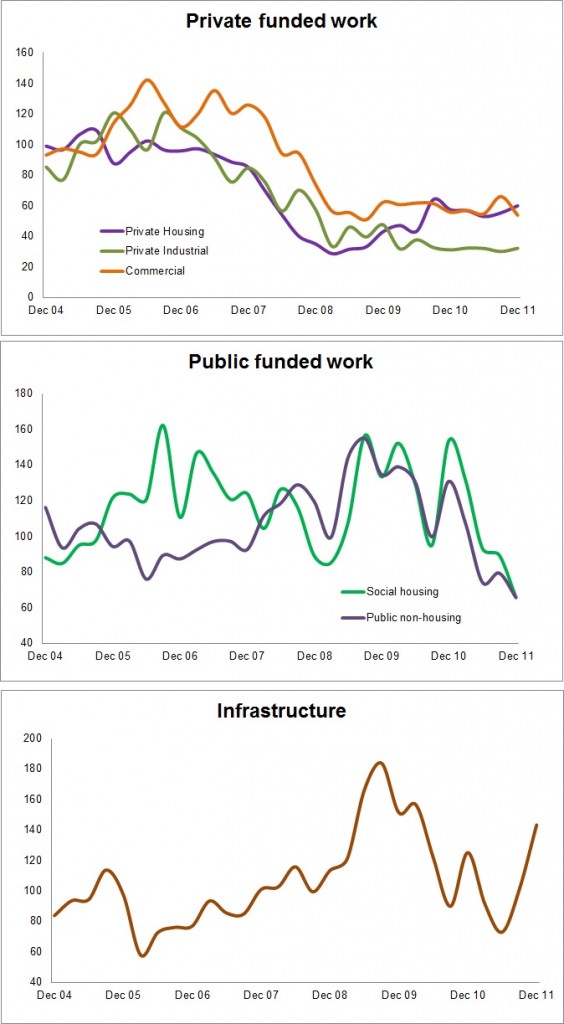
The sector split of orders is very clear. We are witnessing a rapid decline in public funded work after the boost caused by the post-credit-crunch stimulus. However, what is concerning is that private sector orders, on which the industry will rely for growth, remain pretty much flat.
The lift in the orders for housing we saw in the latter part of 2010 was in large part down to the industry rebuilding its production pipeline after destocking in the wake of the crash and was entirely predictable. Given the low level of completions, these latest figures provide little hope that house building numbers will bounce back as the Government hopes.
Meanwhile, we see that orders for infrastructure work are very bouncy and, while there may be some solace in growth in this sector, the future is still regarded by many in the sector as very uncertain.
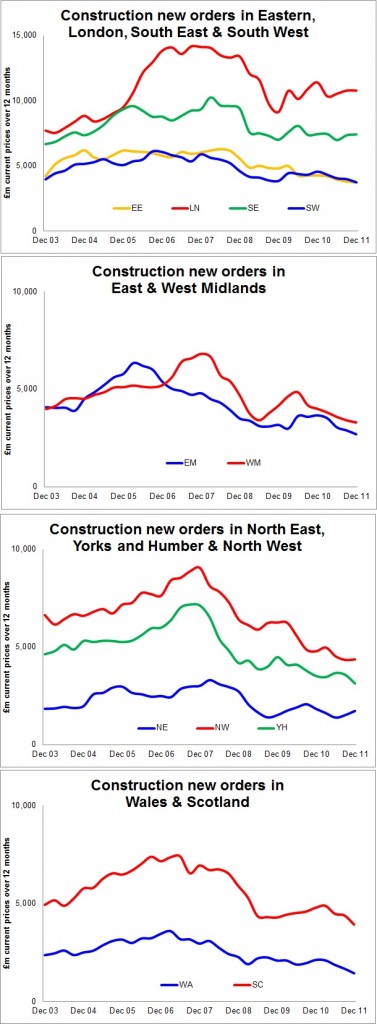
Looked at regionally there are few surprises. London and the South East are performing most promisingly, while most other parts of Britain appear to be in decline.
Overall the pattern of orders does not bode well and does seem to strongly support the view of most industry forecasters that construction will continue to dip into recession.