No Christmas cheer from the ONS new orders figures
The latest construction new orders figures give no comfort to those fearing a nasty second bout of recession in construction.
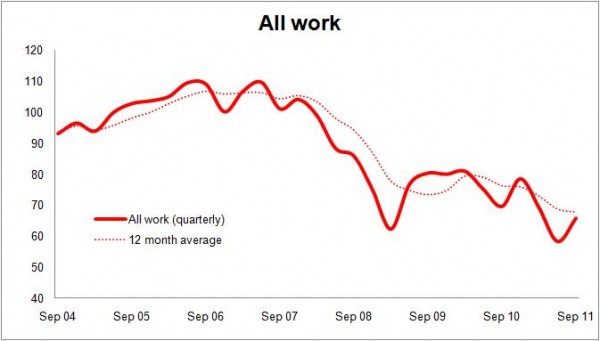
The numbers bounced up a little in the third quarter but remain on a downward path if looked at on an annualised basis, as can be seen from the graph (more graphs below).
 The bounce back was, in the main, due to expected improvement in sectors such as infrastructure and commercial which had experienced a pretty grim second quarter for new orders.
The Office for National Statistics data on new orders does rather throw into question the continued positive results coming from the Markit/CIPS construction purchasing managers’ index.
This seems to show construction growing and more puzzling it shows an optimism growing over further expansion.
One thing that may be keeping the workload on the ground more buoyant is a reduction in the number of larger projects being let.
Smaller projects, by and large, will be shorter so they will translate into output that much more quickly than larger projects.
The data shows that projects worth £10 million or more in the third quarter of this year represented about a third of the total value of work let for contracts bigger than £100,000. This figure compares with an annual average of 40% in 2009 and 2010.
This, however, rather begs the question of what will fill the gap left by the large projects let in 2009 and 2010 when they come to an end.
Addendum
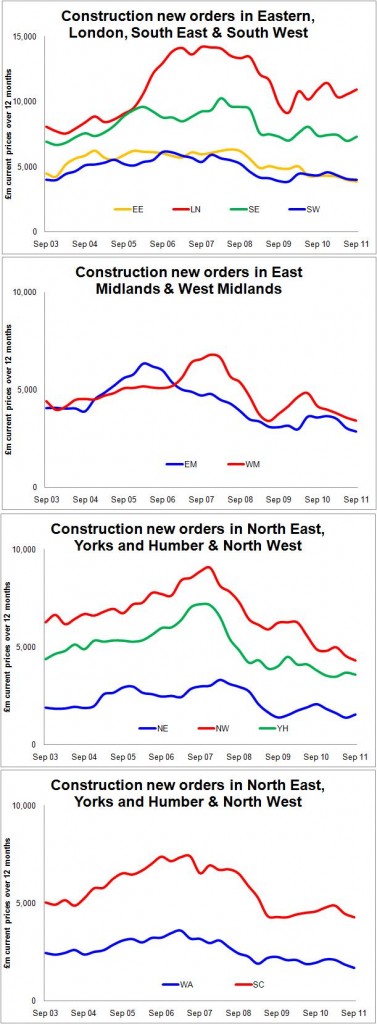
It was pointed out to me, quite rightly, after posting the above that housing in London looked good in the orders figures. And that is true. There are occasional hot spots, which is why it is worth trawling through the detail in the numbers. But given that the overall picture is decline, if one are is on the up it means the rest are doing worse than the gloomy average.
Anyway I have decided to add in some regional graphs of overall construction orders. These are in current prices and are not adjusted for inflation. I am not sure they make the picture look that much brighter unless you are working in housing in London…
![]()