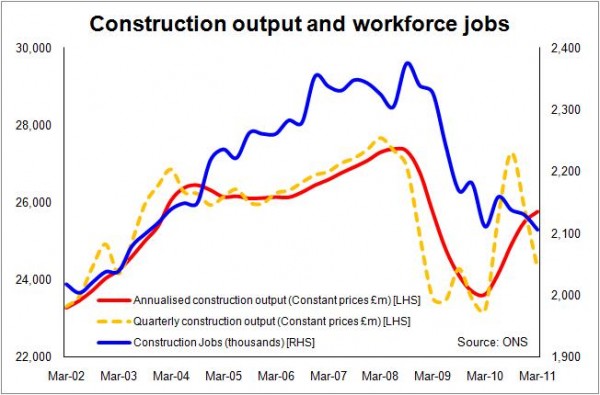
Construction jobs slump to lowest level since 2003
Construction lost a further 24,000 jobs in the first quarter of this year with the number of workforce jobs dropping to its lowest level since mid 2003.
The labour market statistics provide further evidence of the slump in construction activity.
Although it is worth bearing in mind that the more jobs rich repair and maintenance sectors have taken more of a beating than the new work sectors of construction. This would mean proportionately more jobs lost for a given drop in overall activity.

While the labour market statistics may seem to challenge the construction output figures in terms of the size of the upswing mid last year (as can be seen from the dotted yellow line on the graph), it should be noted that the levels of employment will not necessarily trend directly with the wilder swings recorded in workload.
What the employment figures seem to be saying is that the industry is, to all intents and purposes, still falling into recession.
The slowdown in the sector is clear from the level of new orders with the labour market statistics for vacancies also suggest a weakening market. There was a slight improvement in the vacancy figures late last year, but that slight pickup has faded.
We see a similar pattern in the data released today on average earnings. It shows an encouraging rise in earnings for construction workers in each of the first three months of this year, but in April weekly earnings collapsed again.
The seasonally adjusted index of average weekly earnings indicates that construction folk are now earning the same as they were in 2007 – effectively a four year pay freeze.
[As an aside, it is hard not to be puzzled by the shape of the graph showing jobs and output. In the period after 2003, when the construction workforce was rising fast, growth in construction output was very muted.
I have long held suspicions that in the period from late 2003 the old construction output series – up to the end of 2009 – had underestimated actual workload. Without access to the full data I can only speculate, but I have posted some thoughts on this in an earlier blog.
Increasing the figure for output annually by say £6 billion to £10 billion at the peak (as instinct might suggest) would also help to reconcile the levels of output suggested in the new post-2009 construction output series that have been causing some consternation.]
Still, for all the gloom in construction there is a more promising tone to the overall employment figures. This certainly provides some comfort to the industry, especially those in house building.
There appear to be more jobs about, with the workforce jobs measure posting a 121,000 increase in the first quarter and the ILO measure of unemployment dropping 88,000 in April.
To date it seems that the private sector has been more than able to mop up (statistically speaking) losses beginning to come from the public sector. But these losses are so far relatively modest in comparison with what is expected to be in the pipeline.
Meanwhile, those of a cynical nature may find it intriguing that Civil Service numbers actually rose in the first quarter after drops throughout last year.
But even in the overall labour market figures there are some uncomfortable details with the number of jobs for UK nationals dropping again while the number of jobs taken by those from the newer EU countries rising sharply.
Overall though, these figures do little to dispel the view that construction and those folk earning a living from the industry are set for more tough times in the near future.