1.2 million more dwellings than households – is that right?
The latest chapter of the Social Trends analysis produced by the statistician’s at ONS covers housing. It pulls together familiar data and will tell the cognoscenti little or nothing they don’t already know.
But interestingly you don’t have to pass the first graph before widely held assumptions are challenged.
It is taken as fact by the overwhelming proportion of politicians and housing professionals that there is a housing shortage.
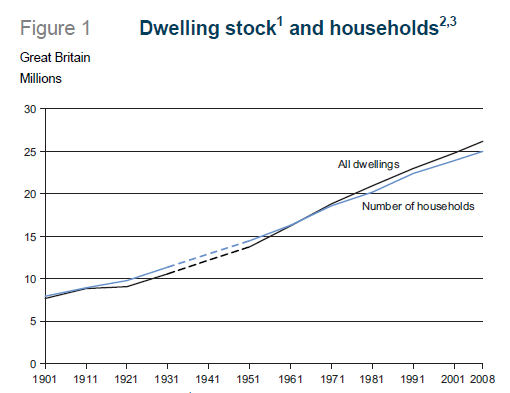 Well here is Figure 1.
Pull the numbers apart and we find that in Great Britain there are about 1.2 million dwellings more than households, despite household size shrinking.
Pulling from other figures outside the document we have one home for every 4.81 inhabitants of Great Britain in 1901, one home for every 3.16 in 1961 and one home for every 2.28 in 2008.
That does rather beg the question: housing shortage, what housing shortage?
Now I support the view that we should build more homes. But am I definitely not in the camp of ignoring the facts while making the argument (outside of a testy pub rant that is).
It is essential if we are to have a satisfactory housing market and satisfactory homes to live in as a nation that we challenge cosy assumptions. They cloud sensible policy making.
So we must look at the need for excess housing and what is driving growth in the greater numbers of homes we have for the number of households.
Some homes will be holiday home businesses.
Meanwhile, some excess in housing is necessary if people are to have choice, that’s logical. Otherwise the last person to pick has what is left rather than a choice.
And some excess is inevitable if we are to have mobility without resorting to tents or hotel rooms.
So some overcapacity is good, as I convince myself when pondering my waist size while buying trousers these days.
But how much excess is reasonable and why has the excess been growing so fast? What, too, are the implications for the distribution of housing within the population?
One thought that came into my mind when looking at the graph was that perhaps there was an effect from increased wealth and income inequality, given that it is the better off that tend to buy homes.
So out of interest I put together a graph that plots the percentage of dwellings in Great Britain above the number of households against the house price earnings ratio (taken from the Nationwide’s figures) and the Gini coefficient (taken from the Institute of Fiscal Studies).
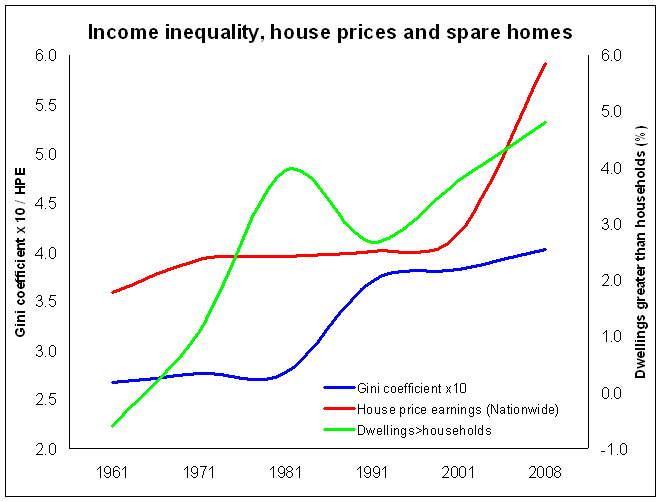 The Gini coefficient is one way to measure inequality and as we can see from the early 1980s onward we have become a less equal society. For the record I have taken the coefficient which excludes housing costs and multiplied it by 10 to fit the graph.
I have taken data points at broadly decade intervals in line with the Social Trends data. This deprives us of subtlety, but what is intriguing is that with the growth in income inequality we have seen a growth in the price of houses relative to earnings and the number of dwellings in excess of the number of households.
What is also interesting is that there was a rapid growth in the number of homes above the number of households through the 1960s and 1970s, presumably linked to the social and private house building boom of the 1960s and early 1970s.
Now I am not suggesting that wealth or income inequality is necessarily or solely the driver of high house prices and an increase in the number of homes we have above households. Nor am I suggesting it is necesssarily why we hold the apparently paradoxical belief that there is a housing shortage while we seem to have 1.2 million spare homes.
The point I am making is that we should not accept without question and thought cosy assumptions that end up becoming accepted truths – especially not when people’s lives and livelihoods are at stake.
Update:
My thanks to Tim Collins for his comment, which quite rightly points out that the figures used within the Social Trends housing chapter do not match the more familiar data posted on the DCLG website.
I asked Social Trends for clarity on this and they say that they have used the household figures from the Labour Force Survey and not the household projections produced by the DCLG. The 25.0 million households in 2008 they say is consistent with the LFS data.
The comment also provides more reasons why we might expect a greater number of homes than households. And it quite rightly points out the inherent problem with the use of the stock/household balance.
The basic questions here are: How much does the number of homes determine the number of households? And how do we determine the appropriate or “natural” number of households that there would be if the number were not constrained by the number of homes? That is before we get into questions of what is socially desirable.
One thought on “1.2 million more dwellings than households – is that right?”
There is something wrong with the numbers underlying the supposed “1.2 million surplus” dwellings.
DCLG statistics give us:
Great Britain (2008)
26,181,000 dwellings
25,359,000 households
A difference of 822,000 (not 1.2 million)
England (2008)
22,398,000 dwellings
21,731,000 households
A difference of 667,000
But these apparent surpluses are very misleading.
The ONS article summary says there were 316,000 vacant dwellings in October 2009, later clarified as long-term vacant. DCLG figures show 770,661 total vacant dwellings in October 2009 in England (783,119 in October 2008). A report some years ago by a DCLG predecessor suggested about 2% of the housing stock is vacant at any time due to “transactional vacancies” – i.e. due to deaths, houses being done up, repossessions, emigration before sale, people who have gone into an institution, etc. In other words, even with massive and successful policy intervention on empty homes, you could only ever reduce the vacancy rate to a minimum of about 2%.
In addition, there are about 246,000 second homes in England.
The balance between occupied dwellings (i.e. after deducting vacant dwellings and second homes from the total stock) in England shows a deficit: 21,368 occupied dwellings (22,398,000 minus 783,119 minus 246,000), against 21,731,000 households, a deficit of about 363,000 dwellings. If the vacancy rate were cut to the minimum transactional vacancy rate of 2% (an implausible assumption), and allowing for second homes, there would be a small deficit of 27,000 dwellings in England.
Comparable data for Great Britain (to which the” 1.2 million surplus” refers) do not appear to be available, but I doubt if it is a dramatically different picture. No doubt regional and sub-regional analysis would show significant differences, with the southern regions showing the most acute pressures.
The crude stock/household balance is a dangerous statistic for another reason. In the short to medium term, the number of dwellings will have an influence on the number of households. Most obviously, young people unable to afford a home will live with parents or in multiple occupation housing, thus not counting as separate households – but of course they still exist as people. Therefore the long-term undersupply of housing is feeding back into slower growth of households than would have occurred if there had been an adequate housing stock. For society, the question is whether or not this squeeze on households is desirable.
There are many other indicators of housing stress: our extremely low demolition rate (an 1100 year replacement rate); a low (internationally) vacancy rate; the proportion of young people (20-34) living at home with parents (23%); waiting lists (5 million people; overcrowding; etc.
Finally, in the period 2000-2009, the number of households increased by an average 43,500 per year in excess of expansion of the housing stock, another sign that something is seriously adrift.
Comments are closed.