What house price falls might mean for future housing construction
The Halifax index out today will provide a nasty kick in the stomach for those businesses reliant on stable or rising house prices to prosper.
The monthly fall of 3.6% was the biggest I could find on the historic data spreadsheet that Lloyds Banking Group provides that goes back to the start of 1983. The previous worst monthly fall was 3.0% in September 1992.
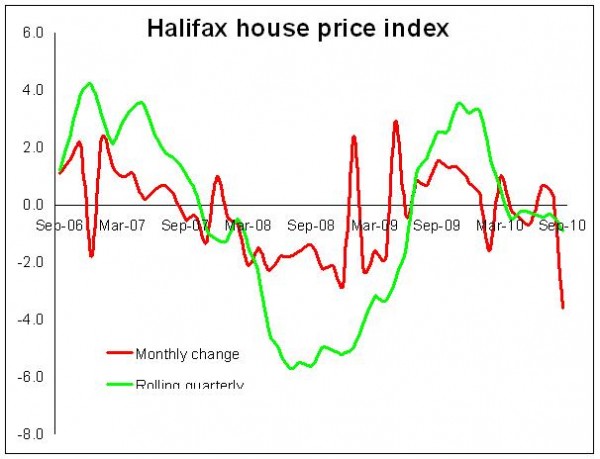 And however much we are advised to look at the quarterly figure and how ever much we know that the data is rather skittish because of low numbers at the moment, that -3.6% fall remains an awful signal in the market.
For construction this comes at a bad time because so much of the data are now pointing to fragility in the market if not a potential tipping point.
There has, for instance, been much note taken of the housing activity index within the monthly Markit/CIPS construction survey. It suggested activity among house builders had shrunk rapidly in September having shown some promising growth in spring.
Certainly, you do not have to stare for very long at the graph I have put together illustrating recent changes in demand, prices and activity within the new housing market to recognise that things are once again looking rather grim for house builders and, probably more so, for those who make money from house builders.
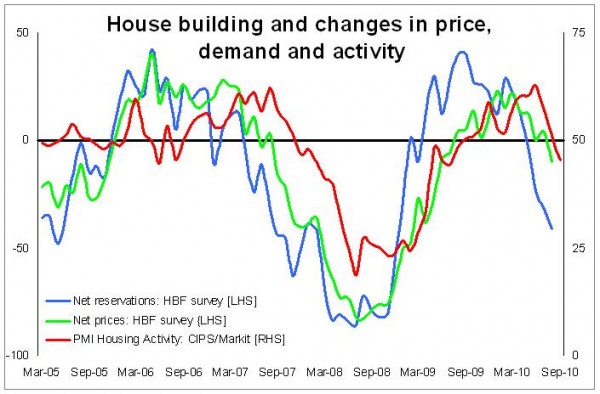 What the graph does is pull data from the Home Builders Federation monthly survey published in Housing Market Report and from Markit/CIPS together.
Crudely put these surveys are based on the balance of responses saying things are up, down or the same on any given scale. In the case of the Markit/CIPS PMI, these are based at 100 with 50 being the no change mark. The HBF survey uses a +100/-100 scale. The big black horizontal line represents “no change” on both scales.
These types of surveys have their detractors and certainly they do not measure the level of activity but the direction and possible pace of change. In that they can be quite sensitive and so can be very helpful in spotting changes and turning points.
What is notable about this combination of data is that the three lines – net reservations (demand, if you like), net prices and building activity – do appear to have tracked fairly closely through the recession with the kind of few months lag here and there that you might have expected. Reservations ease, house price inflation slows and then activity falls off.
So taking a crude reading of the graph we should not be surprised to see the Markit/CIPS line fall quite a bit further in coming months.
The graph certainly points to a nasty fall in activity in house building, which seems almost hard to grasp given that the industry is already running at about half throttle when compared with three years ago.
One thing we might ponder is that if the path the “activity” line travels ends up being as bad as it might appear to be from the graph, then the housing minister Grant Shapps will have some very awkward questions to face when the count comes in on the number of homes built in his first year in office – given his rather bullish pronouncements and his slagging off of the previous administrations record of delivering new homes.
Blame the previous set of lever pullers he might (and I among others have, but probably for different reasons) but if he does not take some swift and decisive action he may well be looking at an even more embarrassing set of questions at the end of his second year – assuming he is not promoted or otherwise engaged by then.
More seriously still, the graph only tells part of the story. We have yet to see the impact on the social sector housing of the impending cuts. The drop in building here could be profound, albeit social housing accounting for the lesser part of the total number of new homes built.
But before we get too carried away, we should accept that the link between falling house prices and falling house building activity is not a simple straightforward one. The graph would have shown this had I cast the data from much earlier.
It is however fair to say that a rapid slowdown in demand and a sharp fall in prices will result in a rapid slowdown by house builders, albeit with a bit of a lag.
So all this uncomfortable data out there at the moment does rather beg the questions of how sharp the fall in house prices might be and what impact it might have on the amount of building work?
Firstly, it is worth tracking back and noting that the first signs of falling house price growth on the horizon seemed to appear in spring – oddly enough when the industry was being bigged up as a result of various reports of sites being opened up.
Unfortunately I suspect that some of the overexcitement at the time about rising house building activity had more to do with the effects of destocking and restocking than with underlying growth.
Either way we should not be too shocked at where we are now as there have been signs of a turning market for some while, although there is certainly plenty of room for disappointment at how things are panning out.
Early in March the housing market survey produced by the surveyors’ body RICS showed a drop in the sales to stock ratio – a spookily reliable indicator of potential changes in house prices. Later that month data on mortgage lending and property transactions also provided cause for concern.
These admittedly were just very early signs and there were numerous cross-cutting influences clouding the picture, but as these indicators tracked the evidence appeared to be stronger that house price inflation was running out of steam.
And from where we now stand there are plenty of pundits prepared to pronounce that we face house price falls up to and around 10%.
But given what we know now, I personally remain in the camp that says house price falls may well prove to be more muted than the general market conditions might suggest, basically because with mortgage rates so low the pressure on potential sellers is reduced. This reduces the likelihood of a flood of sellers tempting a dribble of buyers, which would lead to a sharp drop in prices.
Although we may see the rate of price falls vary markedly across regions in both timing and scale.
And it was interesting to note the IMF, world’s lender of last resort, choose to point to the rather high prices of homes in the UK – clearly a suggestion that they are precariously perched at their current price. A view I can’t help but share.
Frankly though until we see how the Treasury cuts pan out in terms of future unemployment and financial hardship it is hard to make any sensible forecast.
However, while I feel price falls may be less aggressive than some expect, I suspect the relationship between falling prices and house building activity may be more sensitive than in the recent past.
I may be reading too much into the lines on the graph, influenced by the fact that the shape rather fits with my expectations, but house builders appear to be responding far quicker to the turndown in demand and prices this time around than they did last time.
Here are three reasons why and there are others.
The big one is that the major house builders have committed themselves to rebuild and maintain their margins.
The second factor is that they can more easily feather activity to demand with the current product mix of houses rather than flats.
A third reason is that financially house builders are geared up more for retrenchment rather than growth, as they were when the credit crunch bit.
As house builders went into the recession they were forced to build out a huge amount of part-built flats. On many schemes stopping part way through was not an option. Now they are more able to build at a rate closer to that needed to meet demand. This means they will be holding back on sites and phases of sites that they feel will not be sufficiently profitable and that might damage their margins.
Furthermore when the credit crunch bit many firms needed to keep the wheels of their businesses turning to generate cash as their balance sheets were rather awkwardly balanced.
So weighing up the current available information I’d suggest that if prices fall, the majors, at least, will retreat from less favourable schemes and will hold out for better prices, even though this means sacrificing production.
But while the house builders have structured themselves for stormy weather and a reduction, if needs be, in the numbers of homes they build, there remains a huge desire and huge potential to build more homes.
Don’t expect private sector house builders to go for growth and risk their businesses. So if we are to unblock the barriers to the potential of the industry and satisfy the desire for more homes the driving force will have to come from outside the market.
It may be awkward timing with the cuts and all, but the key to building more homes probably rests pretty squarely with Mr Shapps and his colleagues.