Are UK houses really worth 6% more than a year ago?
The final Halifax index for 2009 has been released and it settles on a December 2009 average house price 5.6% above that of December 2008.
This is roughly in line with the figures from Nationwide which show a 5.9% rise.
It is easy from this to draw the conclusion that on average your house is worth about 6% more than a year ago.
That would be an ill-advised assumption at best and foolish at worst.
To hold that view and be consistent you would also have to accept that your home was worth 22% or so less in March 2009 than it was in August 2007 and is now worth 17% less than at peak.
I suspect you find like me that, in conversations, very few people will accept that their properties have dropped hugely in value, unless they are or have been forced sellers.
Hometrack, the property market data business, produces a house price index. It actually suggests that house prices fell in 2009 by a shade less than 2%.
But then again the biggest annual rate of fall Hometrack recorded was little more than 10% against the 19% recorded by Halifax in December last year.
The generally accepted method of gauging prices in the housing market is to base them on transactions and to massage them so that you have as comparable a sample from month to month and over time to reflects the market as a whole.
An interesting figure on this point that Richard Donnell, head of research at Hometrack, provided for me was that two-bed properties account for 18% of stock, but 30% of sales on average over the past five years.
This is not surprising, given that the types of people who tend to buy two-bed properties (particularly flats) are at a more mobile stage of their life.
So what we see is that sales in the market aren’t even across all types of properties. And there will be regional variations to the pattern.
This makes the whole process of coming up with a meaningful “average” number incredibly tricky even in a more normal housing market, but at the moment it is even more difficult because the normal patterns of buying and selling have been shattered.
Each of the submarkets will be responding differently to the post credit crunch environment, not always in predictable ways.
And it is not just the distortions within the mix of properties or regions that we should take note of in trying to understand the meaning of the indexes.
As I have mentioned before the sample of transactions from which the indexes draw their raw data are further skewed (probably upward at the moment) by the changing types of buyers and sellers in the market.
Cash buyers are up as a proportion of the market, first time buyers are down.
There has also been a shift in the type of seller (leaving aside those sales matching the “3D” profile of debt, divorce and death).
With interest rates low, sellers who feel their aspirations are not being met are in many cases inclined to rent out and wait for a better time to sell, even if they are making a loss on the deal. They are under far less pressure than if the cost of money was at a more normal price.
Meanwhile the buyers tend to be the equity rich who are less price sensitive than the equity poor. And I suspect having made a packet out of the housing market in the past are inclined to be more bullish about its prospects.
This means that the sellers are fewer and are selling at higher than the “normal” clearing price. Meanwhile the buyers within the market are more prepared to pay higher prices, particularly as supply is more limited. So transaction prices overall are higher as a result.
So, to answer the above question (Are UK houses really worth 6% more than a year ago?): for those bought and sold in December 2008 and December 2009 on average possibly yes. As for the rest of housing stock – the 99% or so – who knows?
What we do know is that house builders are getting more for the homes they are selling which, as long as it lasts, should help to support house building by making more projects viable.
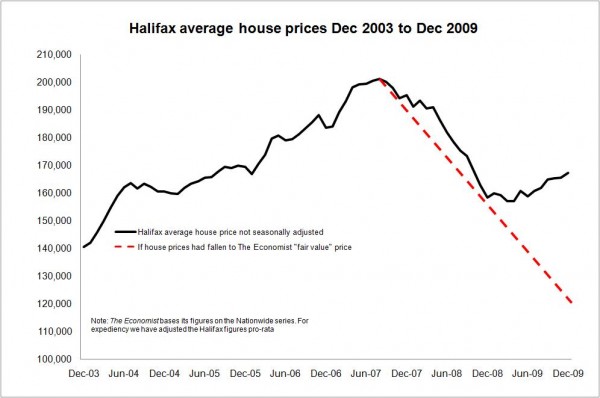
But I for one couldn’t help but notice in the latest issue of The Economist that its international house-price indicators rated British house prices as 28.8% over priced.
The graph above suggests where prices would have fallen to had we reached The Economist’s fair-value price. This value is based on a ratio of rents to house prices.
One thought on “Are UK houses really worth 6% more than a year ago?”
This article makes some very valid points and we are also concerned that the “positive” news in the media from various surveys does not necessarily provide the full picture, but the housebuilders are starting to feel more confident about market conditions and this will be reflected in increased output. The good news is that they are starting to recruit again and will be using our services.
Comments are closed.