Are we witnessing an upswing in construction output? In a word: No
So its official – the construction recession isn’t as bad as we thought. And the even better news is that the sharp fall in output at the start of this year wasn’t anywhere near as sharp as last quarter’s figures had suggested.
That at least is how the national statisticians might have us see it.
The official figures for construction workload show a jump of 2% between the second and third quarters of this year. Workloads were boosted, the figures suggest, by a massive 10% leap in the repair and maintenance sector, which offset a fall of 4% in new work.
This leaves the industry overall down by a shade more than 11% on an annualised basis from its peak.
Meanwhile, the revisions made to earlier figures suggest that the drop in output in the final quarter of last year and the first two quarters of this year was less than they first thought.
This all looks like fantastic news in the light of the gloomy projections being made. Does this mean that the recession is easing?
Well, no. Sadly nothing could be further from the truth.
Firstly, taking the figures at face value, the reason workload has gone up is largely down to a huge increase in public spending. More pounds Stirling from the public purse were spent on construction in the third quarter of this year than at any time ever.
And, what is more with construction prices falling, that public money is buying a lot more work pound for pound, so it is generating a heck of a lot more workload.
Now we all know the likely path of public spending is paved with pot holes and uncertainty. So any surge in workload produced by this boost in public sector cash is temporary at best. Not that it has been unwelcome.
Meanwhile, it is the repair and maintenance sector rather than the new build work that appears to be buoyant. Accurate data on the RMI sector work is notoriously hard to get and one should always maintain some scepticism about the recorded figures.
So if for now we just look at the new work data, it is worth working out what lies beneath the headline figures.
Following the money rather than the statisticians’ estimates for the volume of work done we probably get a more accurate picture of what is really going on.
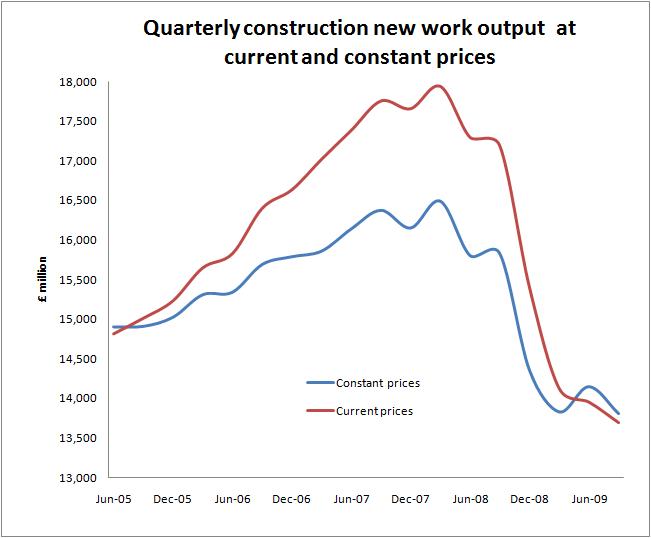 What we see from the graph, which tracks the money coming in (current prices) with the volume of work (constant prices), is how the price of work is now below the level of 2005.
There has been a 23.7% drop in the money taken by contractors for the new work they have done from the peak level in the spring of 2008. And the cash is steadily shrinking.
If you accept the official statistics this 23.7% less cash is buying 16.7% less work, which suggests construction prices have fallen by about 9.4%.
Click on graph to enlarge
Frankly, if I was contractor it is the 23.7% less cash that would be bothering me most, as I looked at the how to pay the wage bill.
If we look at the various sectors we see more starkly the reality on the ground. If we compare the cash taken in by contractors in the third quarter of this year with that taken at peak we can see a fall of 50% in new house building, 55% in industrial work and 37% in commercial work.
Those holes will take a lot of filling before the construction industry returns to anything like the health it was in before the credit crunch.
Now let’s pull apart the repair and maintenance figures.
Firstly, the statisticians would have us believe that prices for refurb work are pretty much holding up and have fallen by about 1% from peak. This is despite the near 10% fall in new work prices.
The good news is that if they are wrong and prices have fallen by more than 1% then technically there will have been steadily increasing amounts of work done.
Somehow, judging by the yelps of anguish we hear from the Federation of Master Builders, I suspect that in reality there is a lot less repair and maintenance work about, which is not the picture painted by the official figures.
One of the possible explanations for the apparent waywardness of these figures may oddly lie in the migration data and what might be described as the “Polish problem”.
The statisticians have to make estimates for the work they know exists but can’t see or directly measure. They use employment data to help them. The trouble is that the employment data is fine when things are stable, but when there is an increased level of migrant labour in the mix it all gets muddled.
Broadly speaking there is a case to suggest that the repair and maintenance figures underestimate reality when the proportion of migrant workers is high or rising in construction and overestimate it when the proportion falls.
There is anecdotal evidence to suggest that there was a sharp fall off in the number of Poles working in the UK this year and that the mix of UK residents to Polish workers in the construction workforce might have shifted.
Could it be that this has led to an overestimation of the amount of repair and maintenance work recorded?.
Who knows? The figures could be representative. But, they don’t feel like it, and I for one would take that series of figures with a huge pinch of salt and it is probably worth concentrating on the new work figures if you want to get a feel for what is happening in construction.
And the picture the new work figures paint is pretty scary, despite the valiant attempts by the Exchequer to keep the industry afloat in the run up to the General Election.