Construction seems to be back in recession and this time its the big firms in the firing line
I will be shocked if construction is not in a technical recession when the first quarter figures are published in a month’s time.
That is providing the official construction output data for Great Britain released today is not fantastically revised.
What is more we should expect to see bigger contractors squealing the most, as it is the markets they dominate that seem to be under most pressure.
I have done a few back-of-an-envelope calculations and (unless I am very much out of whack) to avoid dipping into recession the industry would have had to have done more work this March than it has in any single month for more than three years.
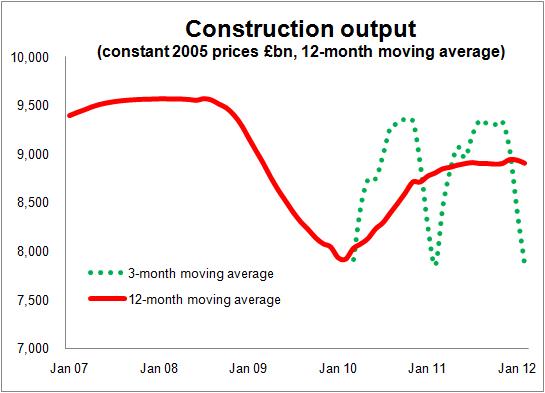 The graph shows the moving 12-month average of construction output and the erratic three-month moving average, which illustrates the problems of being too adamant in drawing conclusions.
For all that it clearly shows the industry coming off the boil, but it doesn’t look too threatening.
Sadly, though, when you delve into the numbers there’s plenty to be worried about.
It is easy to produce a case that says we could be looking at a drop in seasonally-adjusted construction output of more than 5% in the first quarter of this year to add to the 0.2% drop we saw in quarter four 2011.
If this does happen it will catch more than a few economists and policy makers by surprise. There has been in these quarters a rather unnerving level of optimism over construction that I touched on in a recent blog.
But the official data now strongly suggest that public sector work is finally plunging after holding up well for many months. Meanwhile the private sector is struggling to fill the gap.
The big question is whether the industry this year enjoyed the normal March surge in publicly funded work. Who knows?
But that’s a slender hope to be holding onto given implications of the latest set of data.
It’s silly to place too much emphasis on one or even two month’s figures, but recorded output in January and February this year is down 3% on the same period last year.
That is despite much milder weather and the extra day from the leap year. Adjusting for the leap day alone increases the drop to more than 5%.
These data will be revised and, as things stand, the revisions tend to be upward. There are also weird lag effects in the data, which may work for or against a better than expected March figure (if for instance some of the effect of the leap day falls into the March data). These I have looked at in an earlier blog for those interested.
And we should not forget that the construction output data is for Great Britain not the UK.
But I suspect that by the time the latest data plus some further late returns and analysis is passed to the folk who put together the GDP figures the outcome of their processing will be a nasty drop in construction’s contribution to national output.
The scale of the volatility of construction can have quite a marked impact on the GDP figures even though the industry accounts for less than 8%.
The good news for optimists is that weird things do happen and I could be very wrong. Still, we’ll see.
Now, looking at the data in more depth (and here I must praise the splendid folk at ONS who have added a new layer of detail) one can elicit some interesting insights into what we should expect in the coming months.
My guess is that we should expect to see more of the “restructuring for growth” announcements from big contractors along the lines of the one made by Balfour Beatty of late.
There are two reasons that lead me to this thought. One: the rapid slump in public sector work. Two: the reduction in the proportion of larger contracts being let.
The second point I covered in a blog yesterday, so I’ll leave it at that.
But the first point, which in many ways is linked to the second, is worth noting.
Table 10 of the new-look construction output figures provides a breakdown of work by size of firm.
What it shows is that the bigger firms have the greatest exposure to the public sector and that’s ignoring their greater exposure to PFI and infrastructure.
So while those firms with a turnover of more than £60 million or with more than 100 employees have a market share of about 40% of all work, their share of the public sector work is about 50%.
Straightforward public sector building work on average accounts for about 30% of their workload compared with much less for most of the smaller contractors.
What we have seen is that while workloads overall have held up pretty well (work over the three months to February was broadly equivalent to that of a year ago), public sector work is now plunging.
There was a drop of 11% on straightforward public sector building work comparing the three months of February with the previous year’s figure. The spending cuts are now biting hard.
This will hit big firms harder than smaller firms.
So it should come as no surprise to see more restructuring within the major firms and to see many of them trading down ever more into markets normally serviced by smaller contractors.