Why last week’s rise in inflation should not have been a surprise but an important reminder
The Bank of England seems to have taken a kicking in the press following the release last week of the Office of National Statistics estimate for inflation in March.
The reports seem to fixate on the uptick to CPI inflation from 3.4% in February to 3.5% in March.
This rise did not fit, in the view of many economic commentators, the script written by the Bank of England in its latest Inflation Report. Although in fairness the report did point to a huge amount of uncertainty.
But the rise should not have come as a particular surprise, particularly given the recent volatility in the figures. More importantly it would be wrong to read the figure as a sign of inflation accelerating.
What it is more likely to be a sign of, however, is that the rate of underlying inflation is much stronger than the Bank believes. And that it has been so for some time.
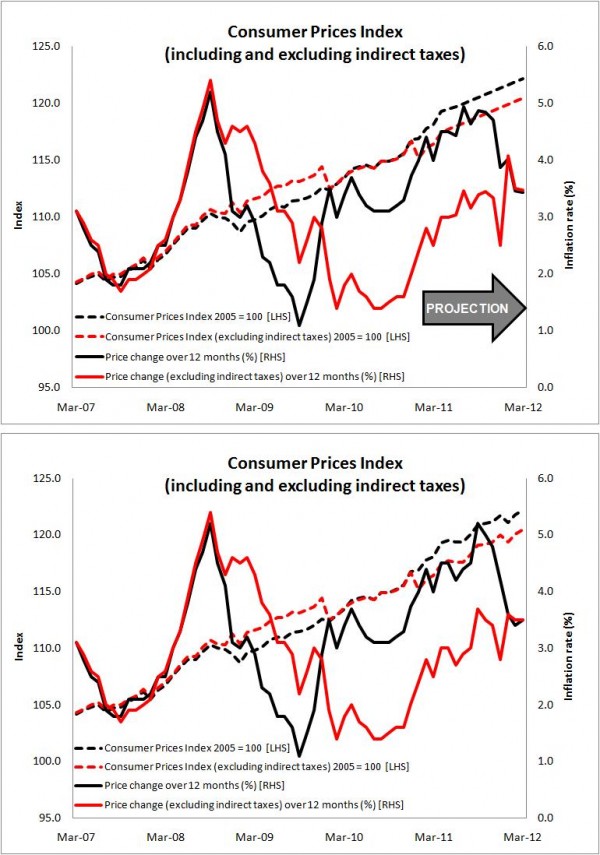
To illustrate my point here’s a graph (the top one) I use to help me see through the odd base effects and policy shifts that influence the headline rate of inflation. I last updated it in June last year with the May inflation figures. (Slack I know, but time’s limited)
 It shows my projection then of where inflation might go if it followed broadly its trend increase. I have used it before to make points. I like its simplicity.
I create this projection by adding a simple increment to the CPIY index (the one that excludes indirect taxes). I feather the trend growth so it looks about right on the graph and to that I add a factor to get the headline CPI rate.
The maths are crude, but it’s only there to help me avoid saying stupid things about the inflation rate.
(For those who want the figures I used, here’s the back-of-an-envelope calcs. In June last year I chose to add 0.275 per month to the CPIY index for the year ahead. This comes in at average inflation rate of about 2.8%. To get the CPI index I added 1.7 to the CPIY index. This was about the average effect through 2009. From this the inflation rates are simply the percentage change over the year, no dabbling in geometric means across various component indexes or any other statistical fancy stuff. And before you ask I didn’t adjust the increment or the VAT adjustment for inflation.)
One thing the graph does reveal is my view on inflation. Once you strip out tax changes, inflation is and has been running steadily at nearer 3% rather than the target 2% for the past three to four years.
Clearly I thought in June last year, as I do now, that this trend would probably continue, although I suspect I shaded it down at the time as a concession to the consensus which then pointed towards an underlying rate slightly above 2%.
So now let’s look at what actually happened in the second graph.
The main differences are that in reality there was spiking in the CPI rate ahead of the anniversary of the VAT increase and spiking in the CPIY rate after as the base effects unwound. Confusion here is not surprising given the messing about with pricing that VAT changes create. But by February the pattern is more or less in line with the projection.
For me the accuracy of the projection was spooky if not a surprise. The March CPI figure came in at 3.4% and CPIY at 3.5%, against the recorded figures of 3.5% and 3.5%.
What is more unsettling is that I have used this crude graph before, as regular readers will know, and found its predictive powers far more effective than those of the Bank of England.
Leaving flippant jibes aside, there is a more important point. This approach suggested the inflation rate in February and March would probably be about the same, so it should have been no surprise that they were. But it was premised on a consistent rate of underlying inflation that is well above target.
It also throws up bigger questions. Where is inflation going from here? What does it mean for the UK economy?
I suspect in the short term we will see a continued fall in the headline rate of inflation to below 3%. If not then we have real problems.
However, unless something changes to put downward pressure on inflation within the UK we will see the rate bounce back to about 3% as the year unfolds.
Looking beyond the short term, in forming a view of the nearer medium term, a point made in the latest blog by former Monetary Policy Committee member Andrew Sentance is well worth noting.
He suggests, as he has done many times before, that firms will and are now trying to rebuild margins having been squeezed through the recession. Put simply they will release to the consumer some of the inflation pressures they have absorbed over the past few years.
 Looking longer term I come back to my hobby horse. Having enjoyed the fruits of globalisation in the form of cheap imports, there is now a price to pay.
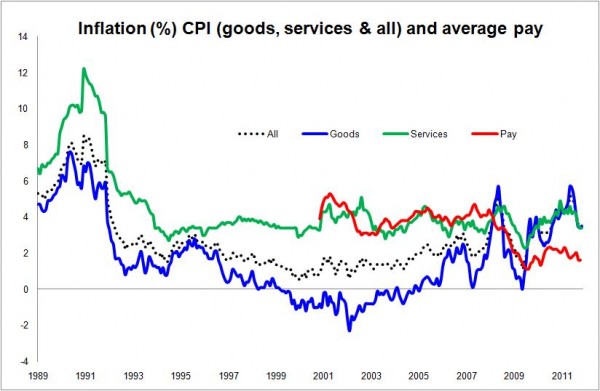
The third graph (yes, I’ve used this before) shows CPI inflation split between goods and services. The distinctions between these are crude, but you get broadly what they are. The graph also shows a crude measure of average pay inflation.
Between 1999 and 2005 goods got cheaper. We had disinflation. To balance for this and maintain inflation on its target the Bank had to allow services inflation well above the target.
As the graph shows there has been a pretty strong if slightly lagged correlation between pay and services inflation. This again is understandable as services are more home grown and rely on people. Goods are increasingly imported.
Accepting that crude view of what has been going on, we can suppose that from about 1995 to 2005 pay rises well above general inflation were almost built in (irrespective of any productivity gains) as were healthy profit margins.
The unfortunate reading of this graph, as I have said before, is that it suggests that from here on in the fight against inflation will be much tougher.
And so it is proving to be.