Latest ONS construction data point to growth in 2011 – that’s not what the industry thinks
Expect another row to erupt over the latest set of revisions to the construction output figures.
If we accept the latest data, the suggestion now is that construction output in 2011 will be up by about 3% on its 2010 level, in the absence of a catastrophic collapse in the final three months of the year.
The revisions added about 1% to official construction output in the first half of 2011. The most notable revision is to growth in output in 2011 Q2. It was revised up from 1.1% as shown in the latest estimate for the UK GDP (although not exactly the same data set) to 2.6%.
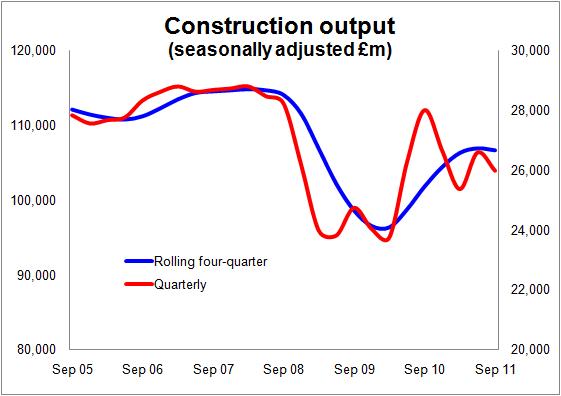
 The figures are consistent with construction on the edge of recession, which is what most in the industry expect. You can see that in the graph.
But the data as they stand sit uncomfortably with the most up-to-date projections from the main industry forecasters which all suggest a fall in output for 2011.
The latest data also sit uncomfortably with the experiences of most businesses in the industry, particularly as the public sector new work remains so strong.
It is important to note that most data is revised as new information is plugged in. But the construction series is new, so the revisions are far greater than might be expected in a more settled series.
However the industry is at such a critical stage so, unsurprisingly, revisions of the magnitude that we are seeing are creating some confusion and irritation among users.
Part of the reason that the revisions this time were so great was that new data coming in was much “better” than had been expected.
The statisticians use an imputation method to make estimates for the figures of missing/late survey returns. As forms are sent back, the imputed figures are replaced with real figures.
This imputation method in recent months had led to a near consistent underestimation of the real figures. This was leading to quite marked upward revisions when the figures for late returns were plugged in (see this earlier blog).
So an upward revision this time was expected.
The imputation method was recalibrated this month to address this issue and lead to more balanced negative and positive revisions. The immediate effect of this change will have been to have rebased the back data upward.
From now on we should expect smaller upward revisions and we may start to see more downward revisions.
If the future revisions are smaller the users of the data – economists, trade associations, lobbyists, media, analysts and business planners etc – will be to some extent relieved.
However there remains a real problem with credibility.
A rise of about 3% in construction this year would seem crazy to many within the industry. There was considerable unease about the 8.2% recorded rise in 2010.
I can’t say with certainty whether the Office of National Statistics construction output figures are close or not close to what is really happening in the industry. But much other data suggests things may not be as the ONS figures portray them.
If this is the case there may be some methodological problems with the series.
There are two “theories” that have some currency among those who chat and speculate about these things.
The first is “survivor bias”. This theory would suggest that when weak companies go bust and stronger companies take on their work, the scaling up of the changed sample leads to an exaggerated figure.
Within the current system there is clearly the likelihood that there will be at least a small amount of this. It is hard to eradicate totally. The question is whether the processes used to scale up the various strata of the sample to get an estimate for the whole population are sufficiently robust so that this is not a significant problem. I can’t answer that.
The second “theory” is that the deflators might be suggesting less inflation in output prices than is actually happening. If construction output prices were going up more than the ONS thinks, it would mean that less work (in volume terms) is being done.
I can’t say if either of these potential problems is present within the construction output series. But the figures represent a surprise on the upside that will unsettle industry experts.
So expect the ONS to come in for another round of quizzing over the construction output figures.