2011 is set to be worst year in decades for UK house sales
The latest set of residential property transactions figures from HMRC (the Revenue) make for rather gloomy reading.
Without a perking up of sales in the final quarter the number of homes sold in 2011 is set be the lower than the slump in 2009.
The seasonally adjusted HMRC data show that the number of homes worth more than £40,000 is continuing to slide.
And, given the way things seem to work, that means we should not be surprised if fewer private sector new homes are built, despite the seemingly positive news from NHBC that private sector registrations in the three months July to September were up 6% compared to the same period last year.
 The HMRC seasonally adjusted figures show the number of homes sold has fallen for four straight quarters.
Ignoring the seasonal adjustment, the first three quarters of this year saw a drop in sales of almost 5% compared with the first three quarters of last year.
Unless the trend reverses and sales more than match those of the final quarter of last year, 2011 will become the worst year for home sales so far in this recession, with fewer than the 859,000 transactions achieved in 2009.
This has likely implications for both prices and how many private homes are built.
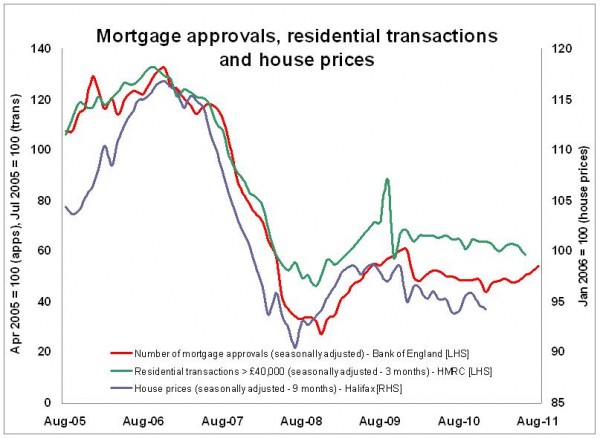
The top graph plotting mortgage approvals, housing transactions and house prices does seem to suggest some kind of link – and that would be no surprise. But I’d be cautious of pushing it too far.
However, as I’ve plotted this graph over recent months it has tended to follow the expected path of flat levels of mortgage approvals, flat levels of transactions and pretty flat house prices.
On that basis, admittedly rather flimsy evidence, I would not be surprised to see house prices continue to subside gently in the absence of any significant events that might cause a big shift in market confidence.
 What is perhaps of greater concern to the construction industry is the implications this all has for house building.
There is no research I am aware of that reveals in any great detail a direct link between overall homes sales and the level of new homes built and what might lie behind it. (If you are aware of any do post me a reference)
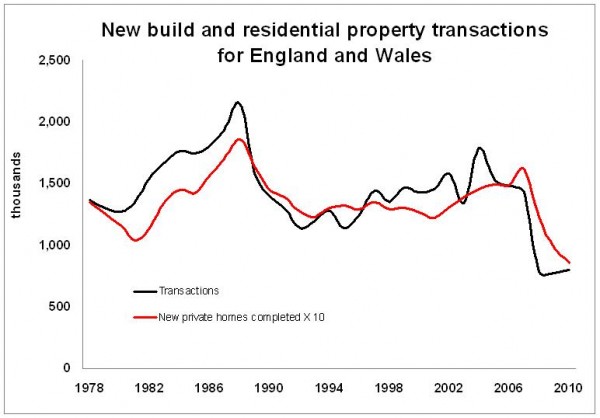
But as the second graph illustrates there is a spooky relationship between the number of homes sold in the market and the number of new homes completed for private sale.
For the record I used the transactions figures from the Council of Mortgage Lenders and the completions figures from DCLG (the communities department).
If this continues to hold, we should expect house builders to rein back on their building.
And I would recommend that the Government should think again on whether its current policies will result in a house building industry that will be delivering 230,000 homes a year by the next General Election.