Don’t read scare stories into the housing figures – we already know things are bad
The latest CLG house building figures for the second quarter of this year seem to be consistent with the view that activity is settling down to a new post-recession lower level.
Much has been and is made of the jumps up and down each quarter in the starts and completions figures.
 But this volatility should be and should have been expected. No more significance should be given to the latest drop in starts than to the buoyancy in the numbers in the 12 months before.
Though one notes that the housing minister and twitter fan Grant Shapps, having been in tweeting heaven over previous upward pointing figures, appears not to have registered this latest batch of data. One naturally suspects that’s because the figures shows a 9% drop in housing starts in England quarter on quarter.
The current pattern in all likelihood has much to do with house builders restocking their development pipelines after slamming on the breaks in the face of the recession. The precise effect of this is hard to predict.
But with starts running at extremely low levels for a year and a half from late 2008, as firms ran down stocks, there would always be a need at some point to boost the numbers of homes in the pipeline. This point appears to have been early to mid 2009.
A common effect in such circumstances is an overshoot in the numbers above the “new normal” level as the stocks are rebuilt. Most likely what we are seeing now is a readjustment down to match the pipeline closer to the expected demand.
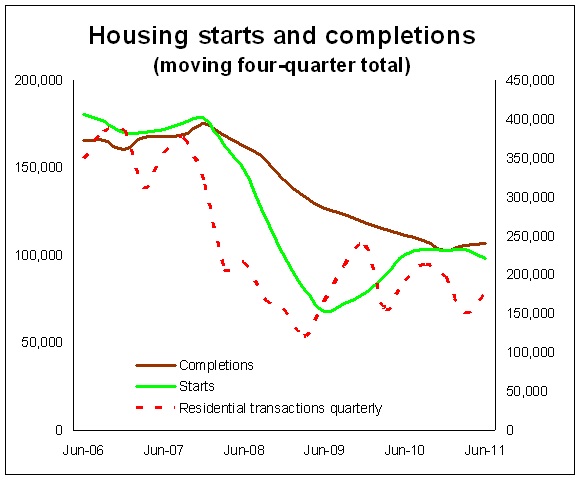
The graph gives a better clue to what I am trying to decscribe.
The rather evident downward blip (not shown in the graph) in housing association starts, however, may be in part a hiatus caused by uncertainty over the new funding regime.
A look at the completions data (see graph) shows how the industry appears to have adapted to the new market. And, unless something dramatic changes in the market, builders looks set to produce at a rate that would produce between 100,000 and 110,000 homes in England a year, with about 80,000 to 90,000 in the private sector.
This pattern seems to fit reasonably well with the pattern of home sales in England. The red dotted line is the non-seasonally adjusted quarterly HMRC figures for housing transactions. Hence they are slightly more volatile than the four-quarter moving total of starts and completions.
But general picture emerging is of a rebased market with house sales and house building running at about half their pre-recession levels.
Within this context a rise or fall of 10% in starts figures is a trifling matter given the perceived need for more and better homes.
Mind you a further drop in starts next quarter would present more of a worry.
One thought on “Don’t read scare stories into the housing figures – we already know things are bad”
I’m more worried about the quality of the house building statistics. There have been some rather large revisions of the last 18 month’s data on starts between this release and the one in March. London in particlar appears to have ‘lost’ a couple of thousand starts.
Comments are closed.